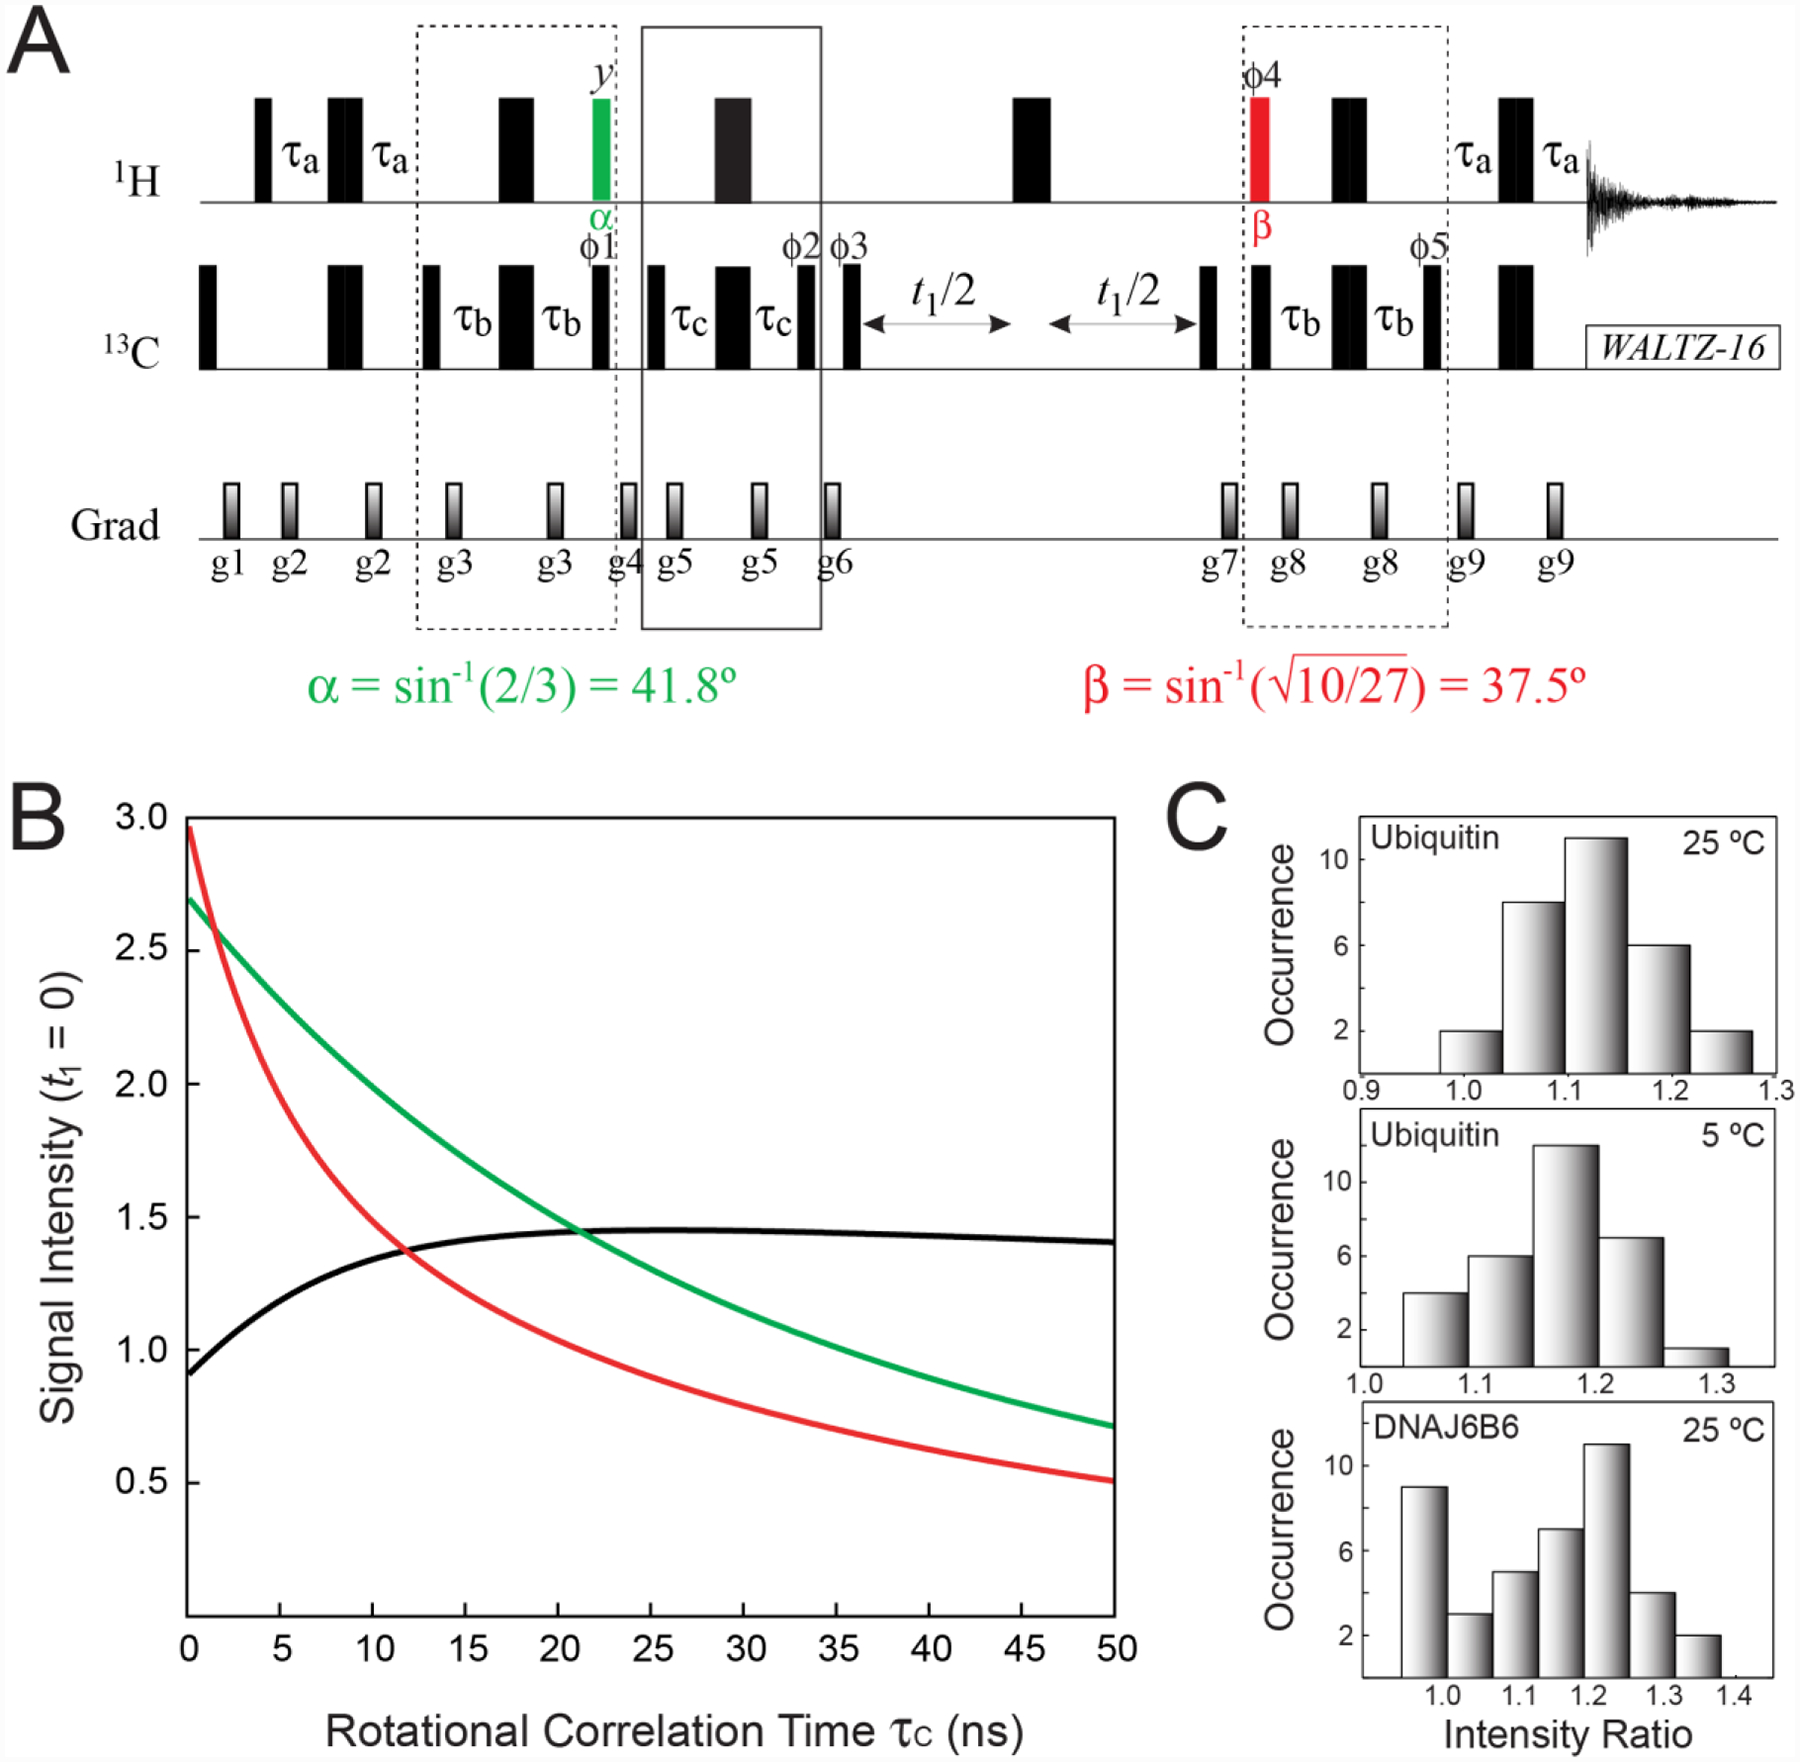
Figure 3.

(A) Pulse scheme for the optimal selection of the slow-relaxing 13C transitions in 13CH3 methyl groups. All the parameters of the scheme are as described in Figure 2A. The 1H pulse shown in green is applied with flip angle α = sin−1(2/3) = 41.8°, while the pulse shown in red is applied with flip angle . The delay τb = 1/(8JHC) = 1.0 ms. The durations and strengths of pulsed-field gradients in units of (ms; G/cm) are: g1 = (1; 25), g2 = (0.4; 15), g3 = (0.5; 12), g4 = (0.8; 25), g5 = (0.4; 10), g6 = (1.5; 20), g7 = (0.7; −20), g8 = (0.5; 15), g9 = (0.4; 10). The phase cycle is: ϕ1 = 4(x),4(−x); ϕ2 = 2(x),2(−x); ϕ3 = x, −x; ϕ4 = 4(x),4(−x); ϕ5 = 4(x),4(−x); receiver phase = (x, −x, −x,x, −x,x,x, −x). Quadrature detection in t1 is achieved via States-TPPI incrementation of ϕ3. (B) Signal intensities (arbitrary units) for the first point of the indirect acquisition dimension (t1 = 0) calculated for the experiment in A (green curve), the SHSQC scheme in Figure 2A (red curve), and the ratio of the two (black curve) plotted as a function of the molecular rotational correlation time τC (ns). Expressions for relaxation rates were taken from (Tugarinov and Kay 2013), with a single external 1H spin placed at a distance of 3.0 Å from methyl protons, and the order parameters of the methyl three-fold axis, S2axis, set to 0.6. Note that the red curve follows the expression in Eq. (1) for t1 = 0. Calculations were performed using the integral form of exp(−R2t2) equal to [1 − exp(−R2t2,max)]/(R2t2,max), where t2,max = 65 ms, and R2 is the transverse relaxation rate of the corresponding 1H transitions (RS2H or RF2H). (C) Histograms of experimental peak intensity ratios obtained for the experiment in panel A and the SHSQC experiment (see Figure 2A) for ubiquitin at 5 and 25 °C and the chaperone ΔST-DNAJB6b at 25 °C. Sample conditions and NMR acquisition parameters are described in the ‘Materials and Methods’ section of the Supplementary Information.
