
Figure 4. Regression and Classification Results on the Validation Set.
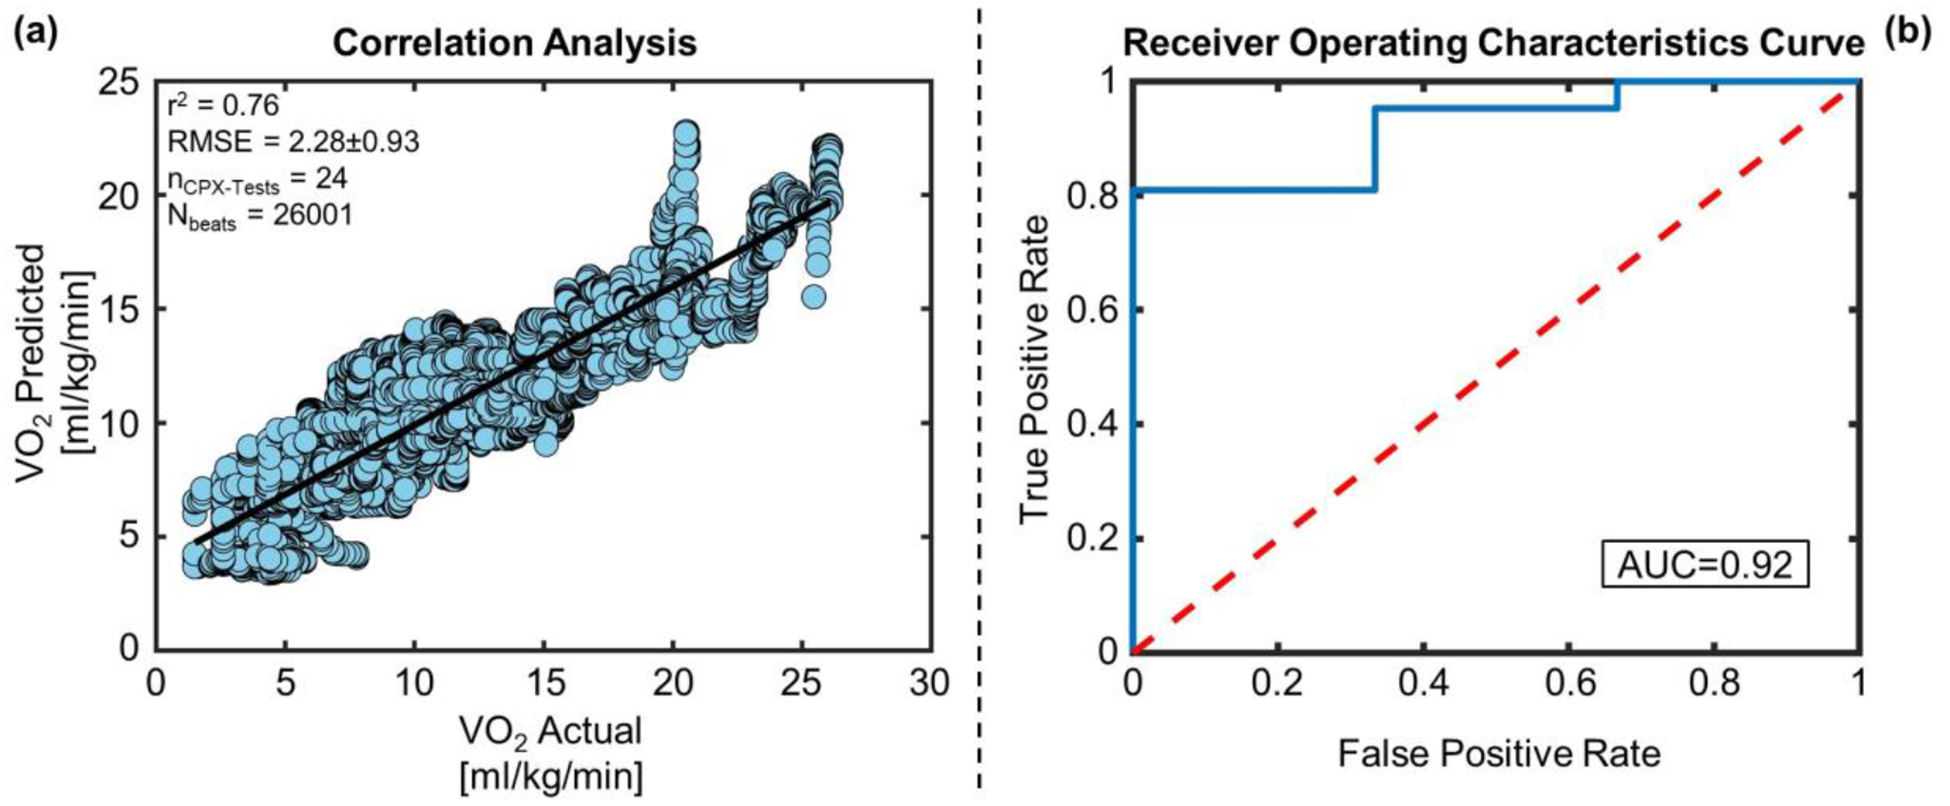
(a) Correlation analysis between VO2 predicted vs VO2 actual for the validation set. (b) The blue curve is showing the ROC curve for the SVM classifier with RBF kernel for the validation set. The red line is the ROC curve for classification based on random chance. The AUC of the blue ROC curve is 0.92.