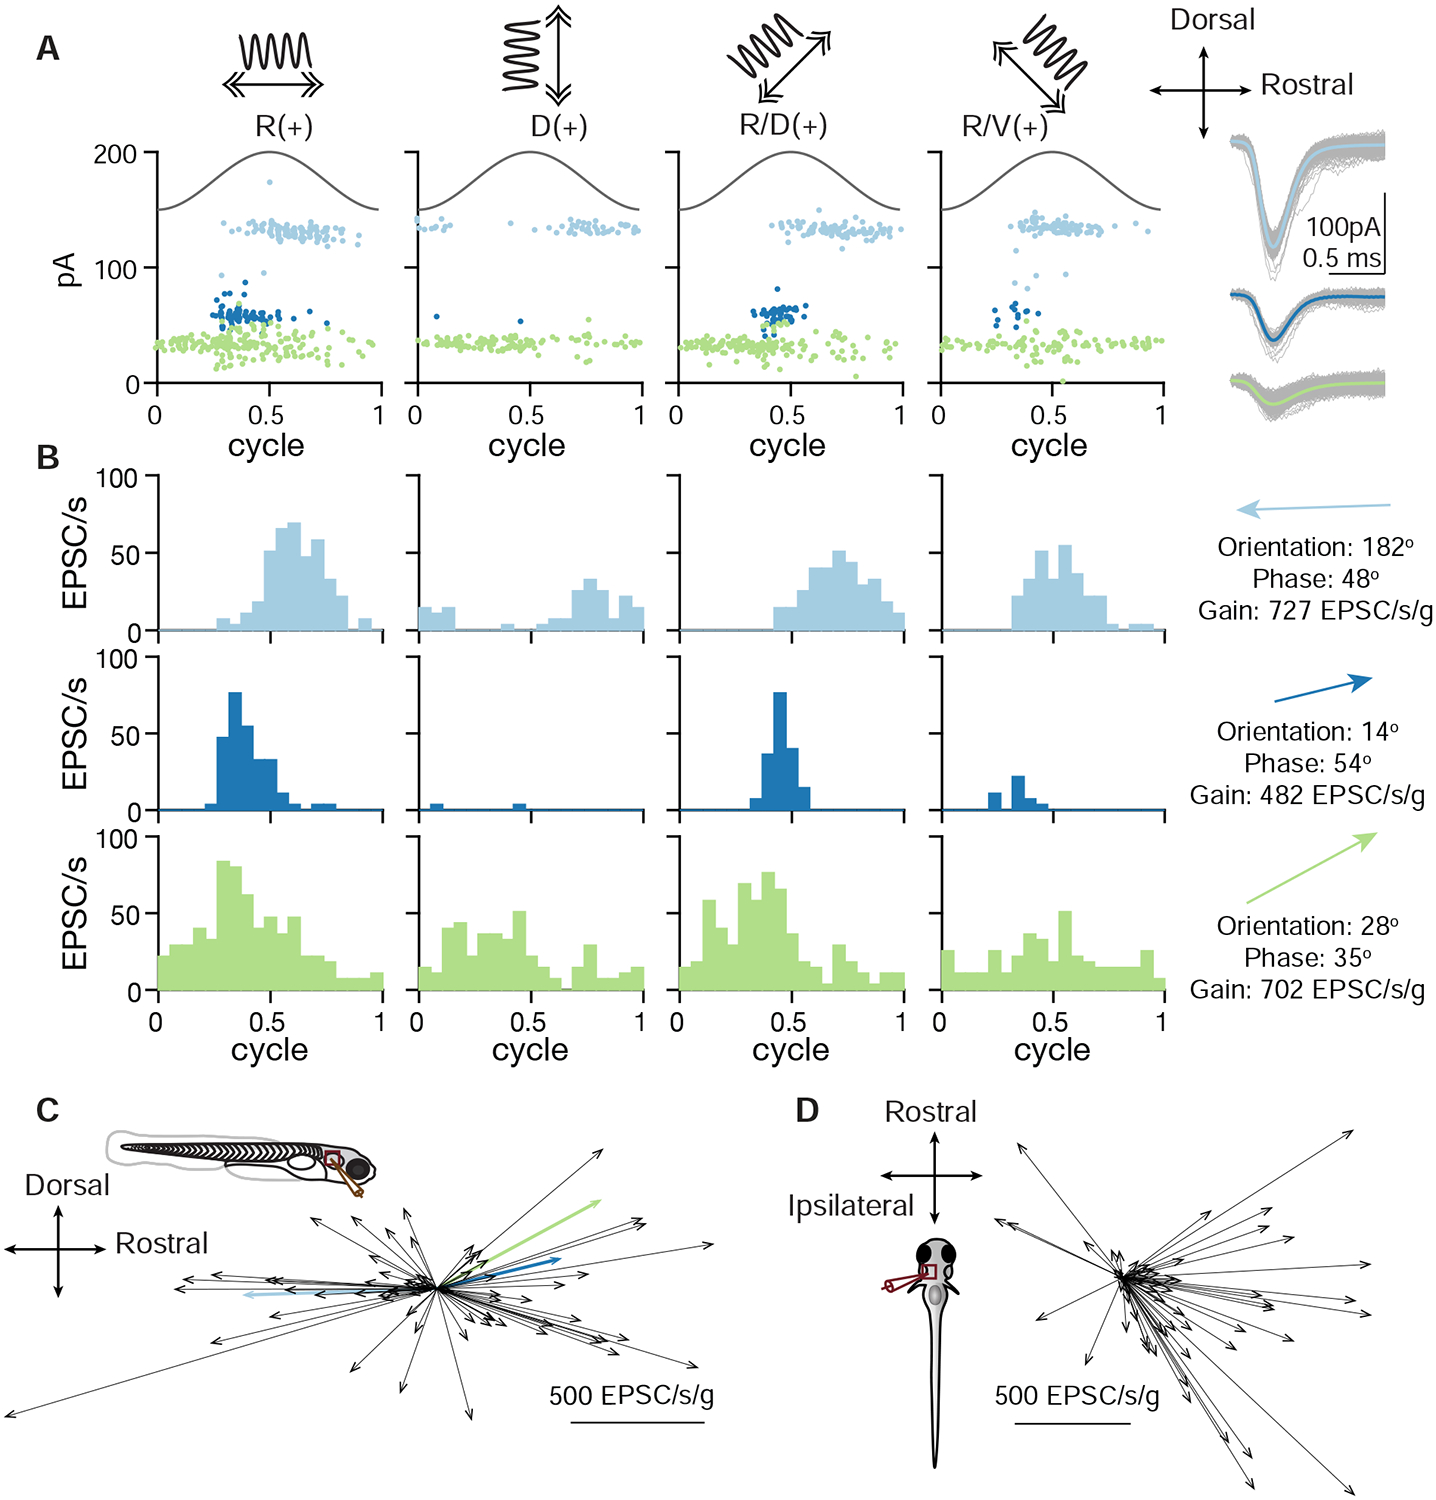
Figure 5:

Spatial tuning of inferred otolith afferents
A. EPSC responses of an example neuron in response to 2 Hz, 0.02 g translational stimuli (solid sinusoidal line, acceleration) along 4 different axes (top, arrows). Each dot represents one EPSC; note three EPSC clusters with distinct amplitudes. Right, overlay of individual EPSCs (gray) and average (colored) for each cluster.
B. EPSC tuning of three clusters. Right, vectors representing the maximum tuning direction, phase, and gain of each inferred afferent corresponding to an EPSC cluster.
C. Maximum tuning directions of all afferents from VS neurons recorded from fish oriented side-up. Colored arrows represent tuning of afferents in B (69 afferents, 43 neurons, 33 fish).
D. Maximum tuning directions of all inferred afferents from VS neurons recorded from fish oriented dorsal-up (60 afferents, 36 neurons, 36 fish).
