
Figure 8:
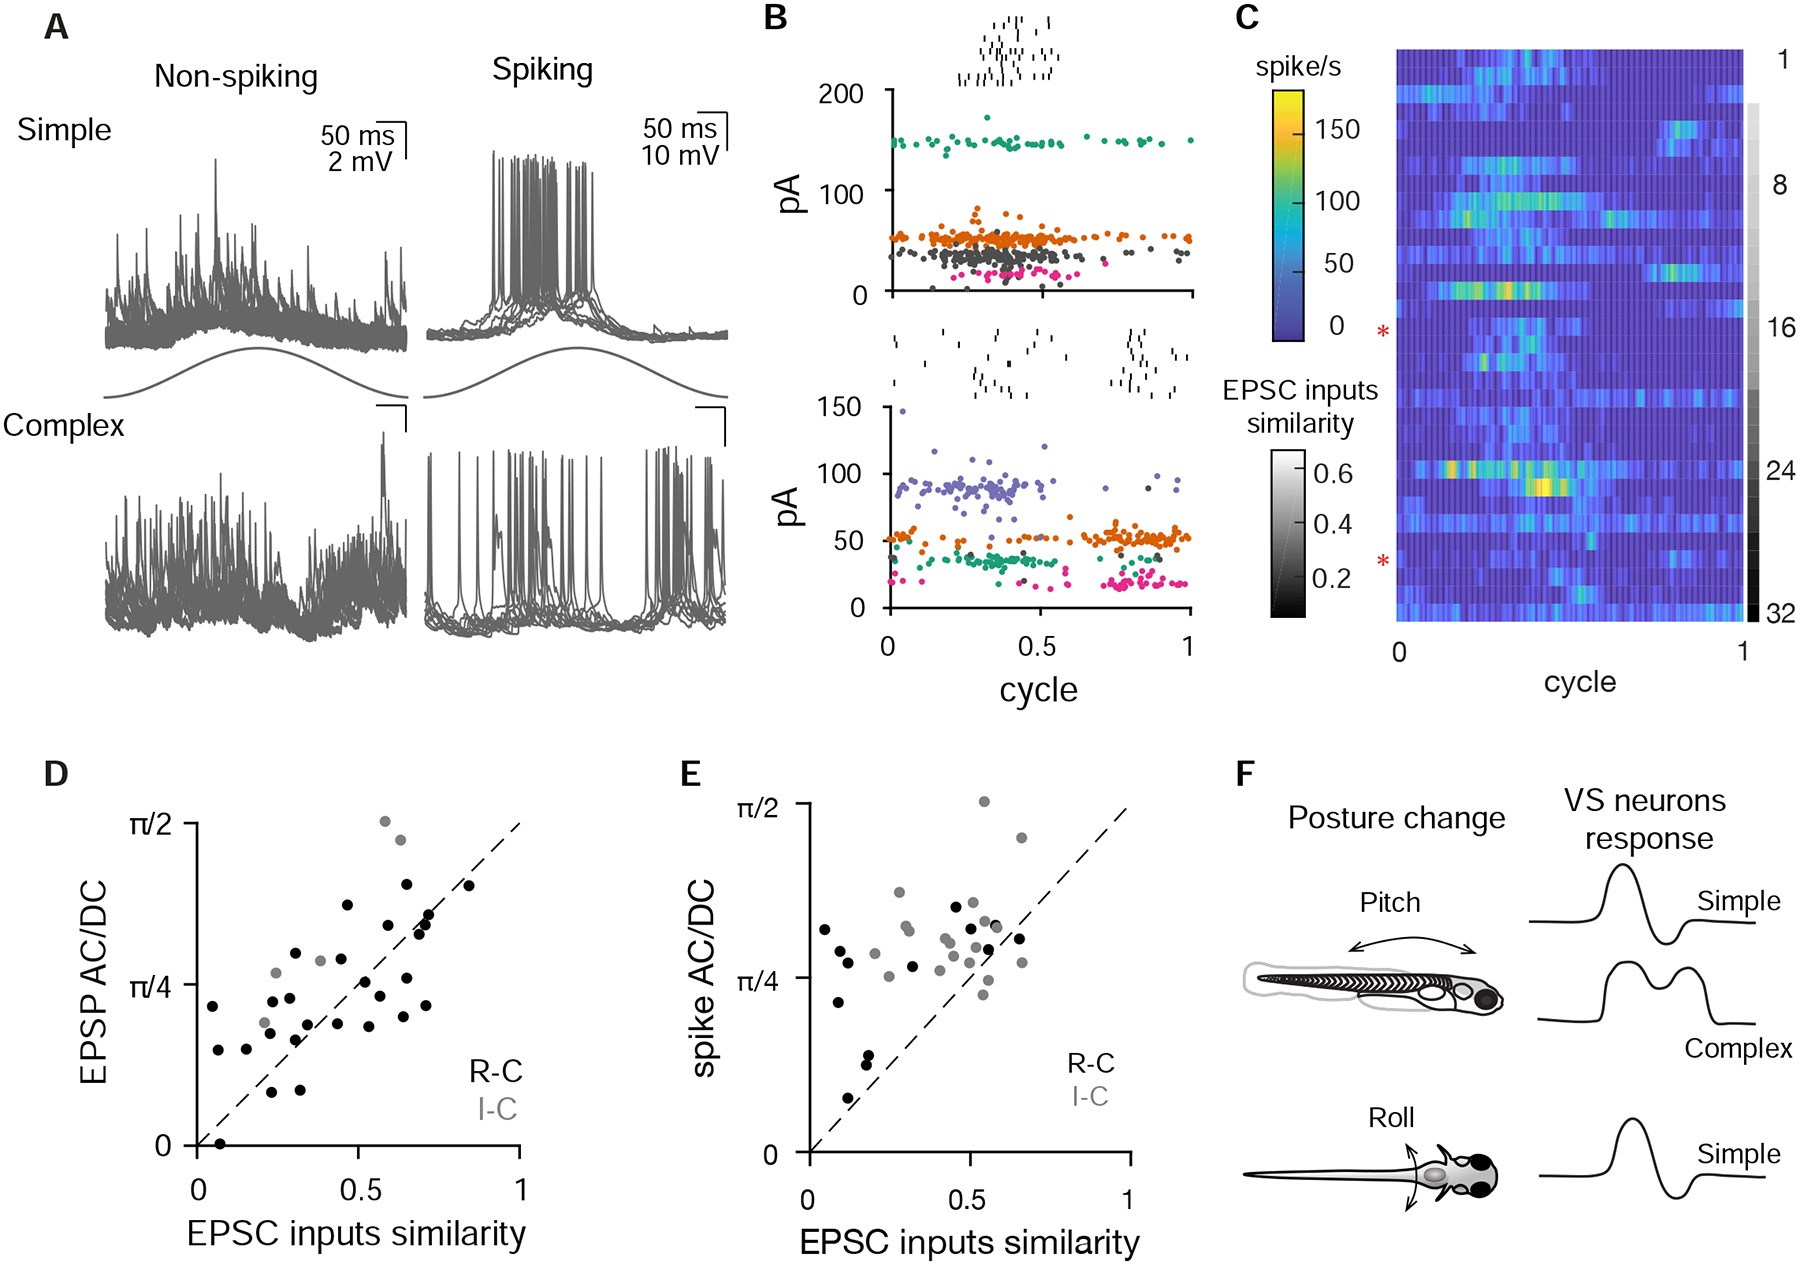
Complex central tuning arises from divergent afferent inputs
A. Example subthreshold and spiking responses from VS neurons with simple tuning (top) or more complex, multi-phase responses (bottom) during 2 Hz, 0.02 g translational movement (11–12 cycles overlaid).
B. Example spiking cells (same as in A), showing that simple (top) and complex (bottom) spiking tuning response are constructed from afferent inputs with similar and different tuning directions, respectively. At top (black) is the sensory-evoked spike raster. Colored and gray dots represent sensory-evoked EPSCs; all the EPSCs with the same color in a panel are inferred to arise from the same afferent. Gray, EPSCs that are not necessarily from individual afferents, based on the absence of clear refractory period structure in autocorrelogram. EPSCs and rasters are from 11–12 cycles.
C. Average spiking rate of VS neurons during a cycle of sensory stimulation, ranked from more similar EPSC inputs to more different EPSC inputs, n=32. Red asterisks label the example spiking simple and complex VS neuron in A and B.
D. Correlation of EPSC inputs similarity index and EPSP AC/DC response ratio (see Methods), for all non-spiking VS neurons with multiple convergent afferents. Sensory tuning of afferent inputs and EPSPs was measured on the R-C axis (black, n=27) and I-C axis (grey, n=5). Dashed, unity line. R: 0.67, p=2.9e-5
E. Correlation of EPSC input similarity index and spike activity AC/DC ratio, for all spiking VS neurons on the R-C axis (black, n=13 recordings) and I-C axis (gray, n=19). Dashed, unity line. R: 0.48, p=5.5e-3.
F. Summary of different VS neuron responses to posture change on the pitch and roll axes.