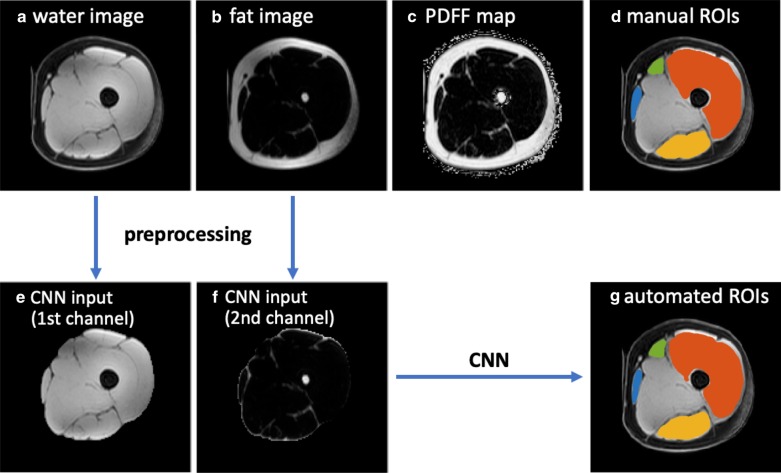
Fig. 3.
A scheme of this study, with MRI images and the segmentation results of an example from Dataset 1 in the testing set. a–c the original water image, fat image and PDFF map provided by Dataset 1, d the manual segmentation masks of four ROIs, e, f the preprocessed water image and fat image covering the whole thigh muscles as CNN input channels, g the automated CNN-derived segmentation masks. For d, g, segmentations are superimposed on the water image, with ROI1 (quadriceps femoris) in red, ROI2 (sartorius) in green, ROI3 (gracilis) in blue and ROI4 (hamstrings) in yellow

