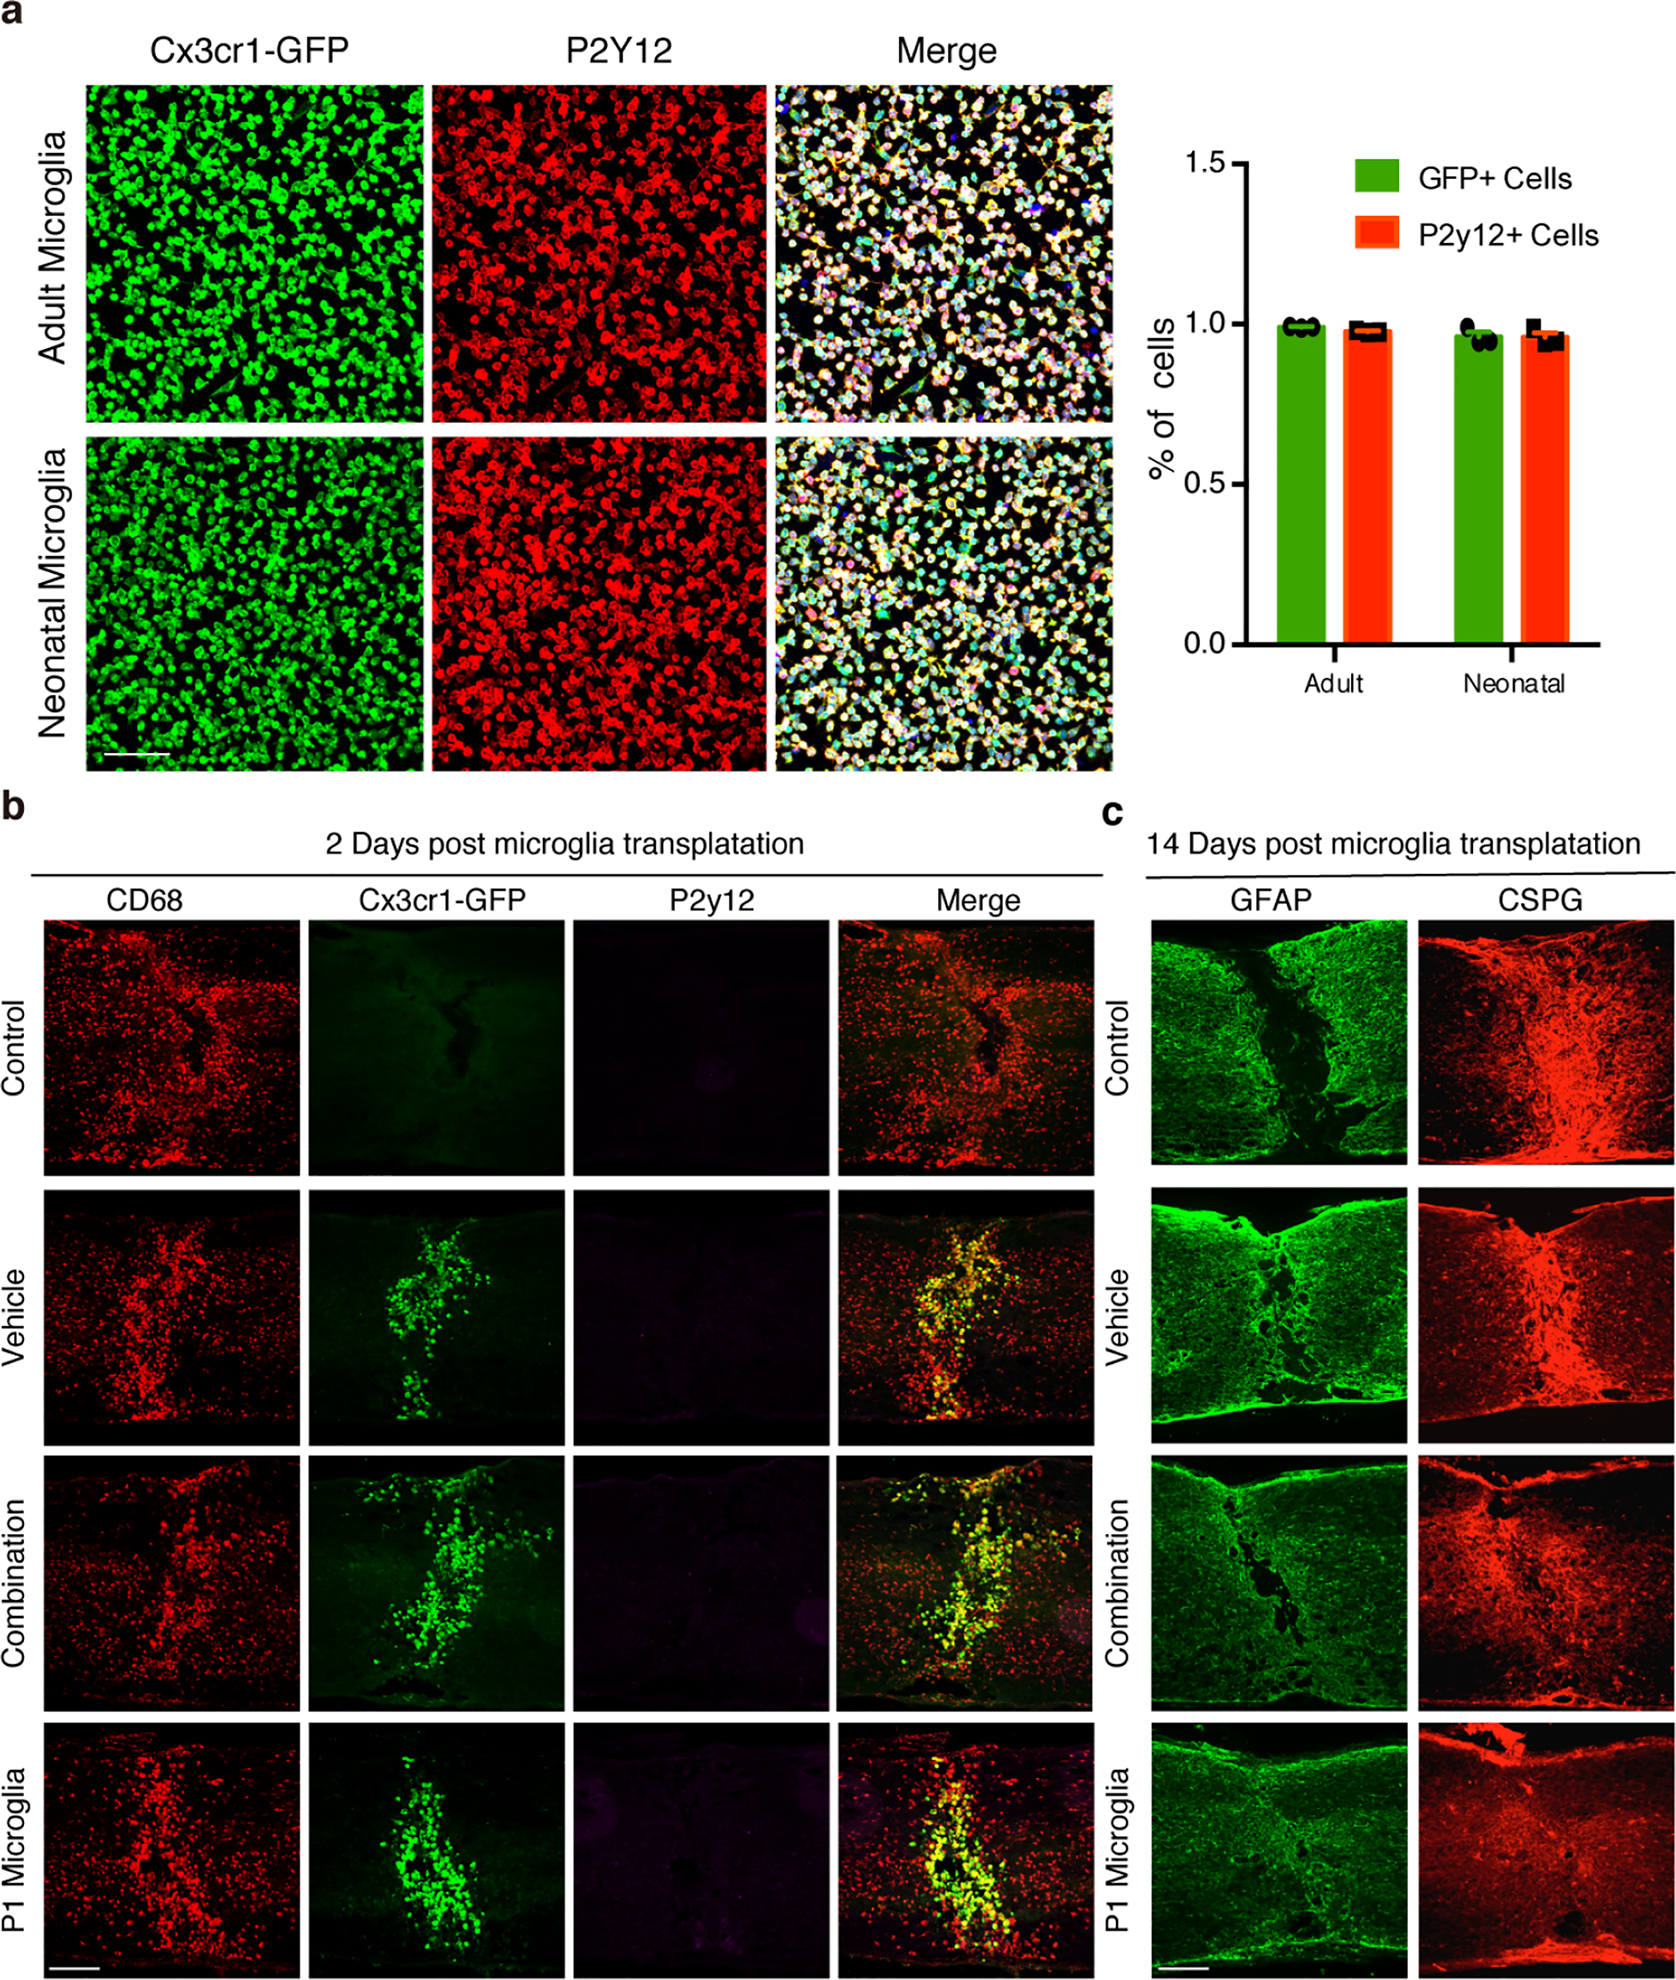
Extended Data Fig. 10 |. Microglia isolation and transplantation.

a, Representative images (left) and quantification (right) of isolated microglia (P2Y12+) from neonatal or adult Cx3cr1-GFP mice, n=400 cells examined over 3 independent experiments. Data shown as mean ± s.e.m. Scale bar: 50μm. b, Representative images of spinal cord sections showing the activation of transplanted microglia in the adult lesion at 2 days after grafting. Scale bar: 250μm. All experiments shown in b, were independently repeated 3 times with similar results. c, Representative images of spinal cord sections showing the GFAP and CSPG in the adult lesion at 14 days after grafting, quantification results were shown in Figure 5d. Scale bar: 250μm.
