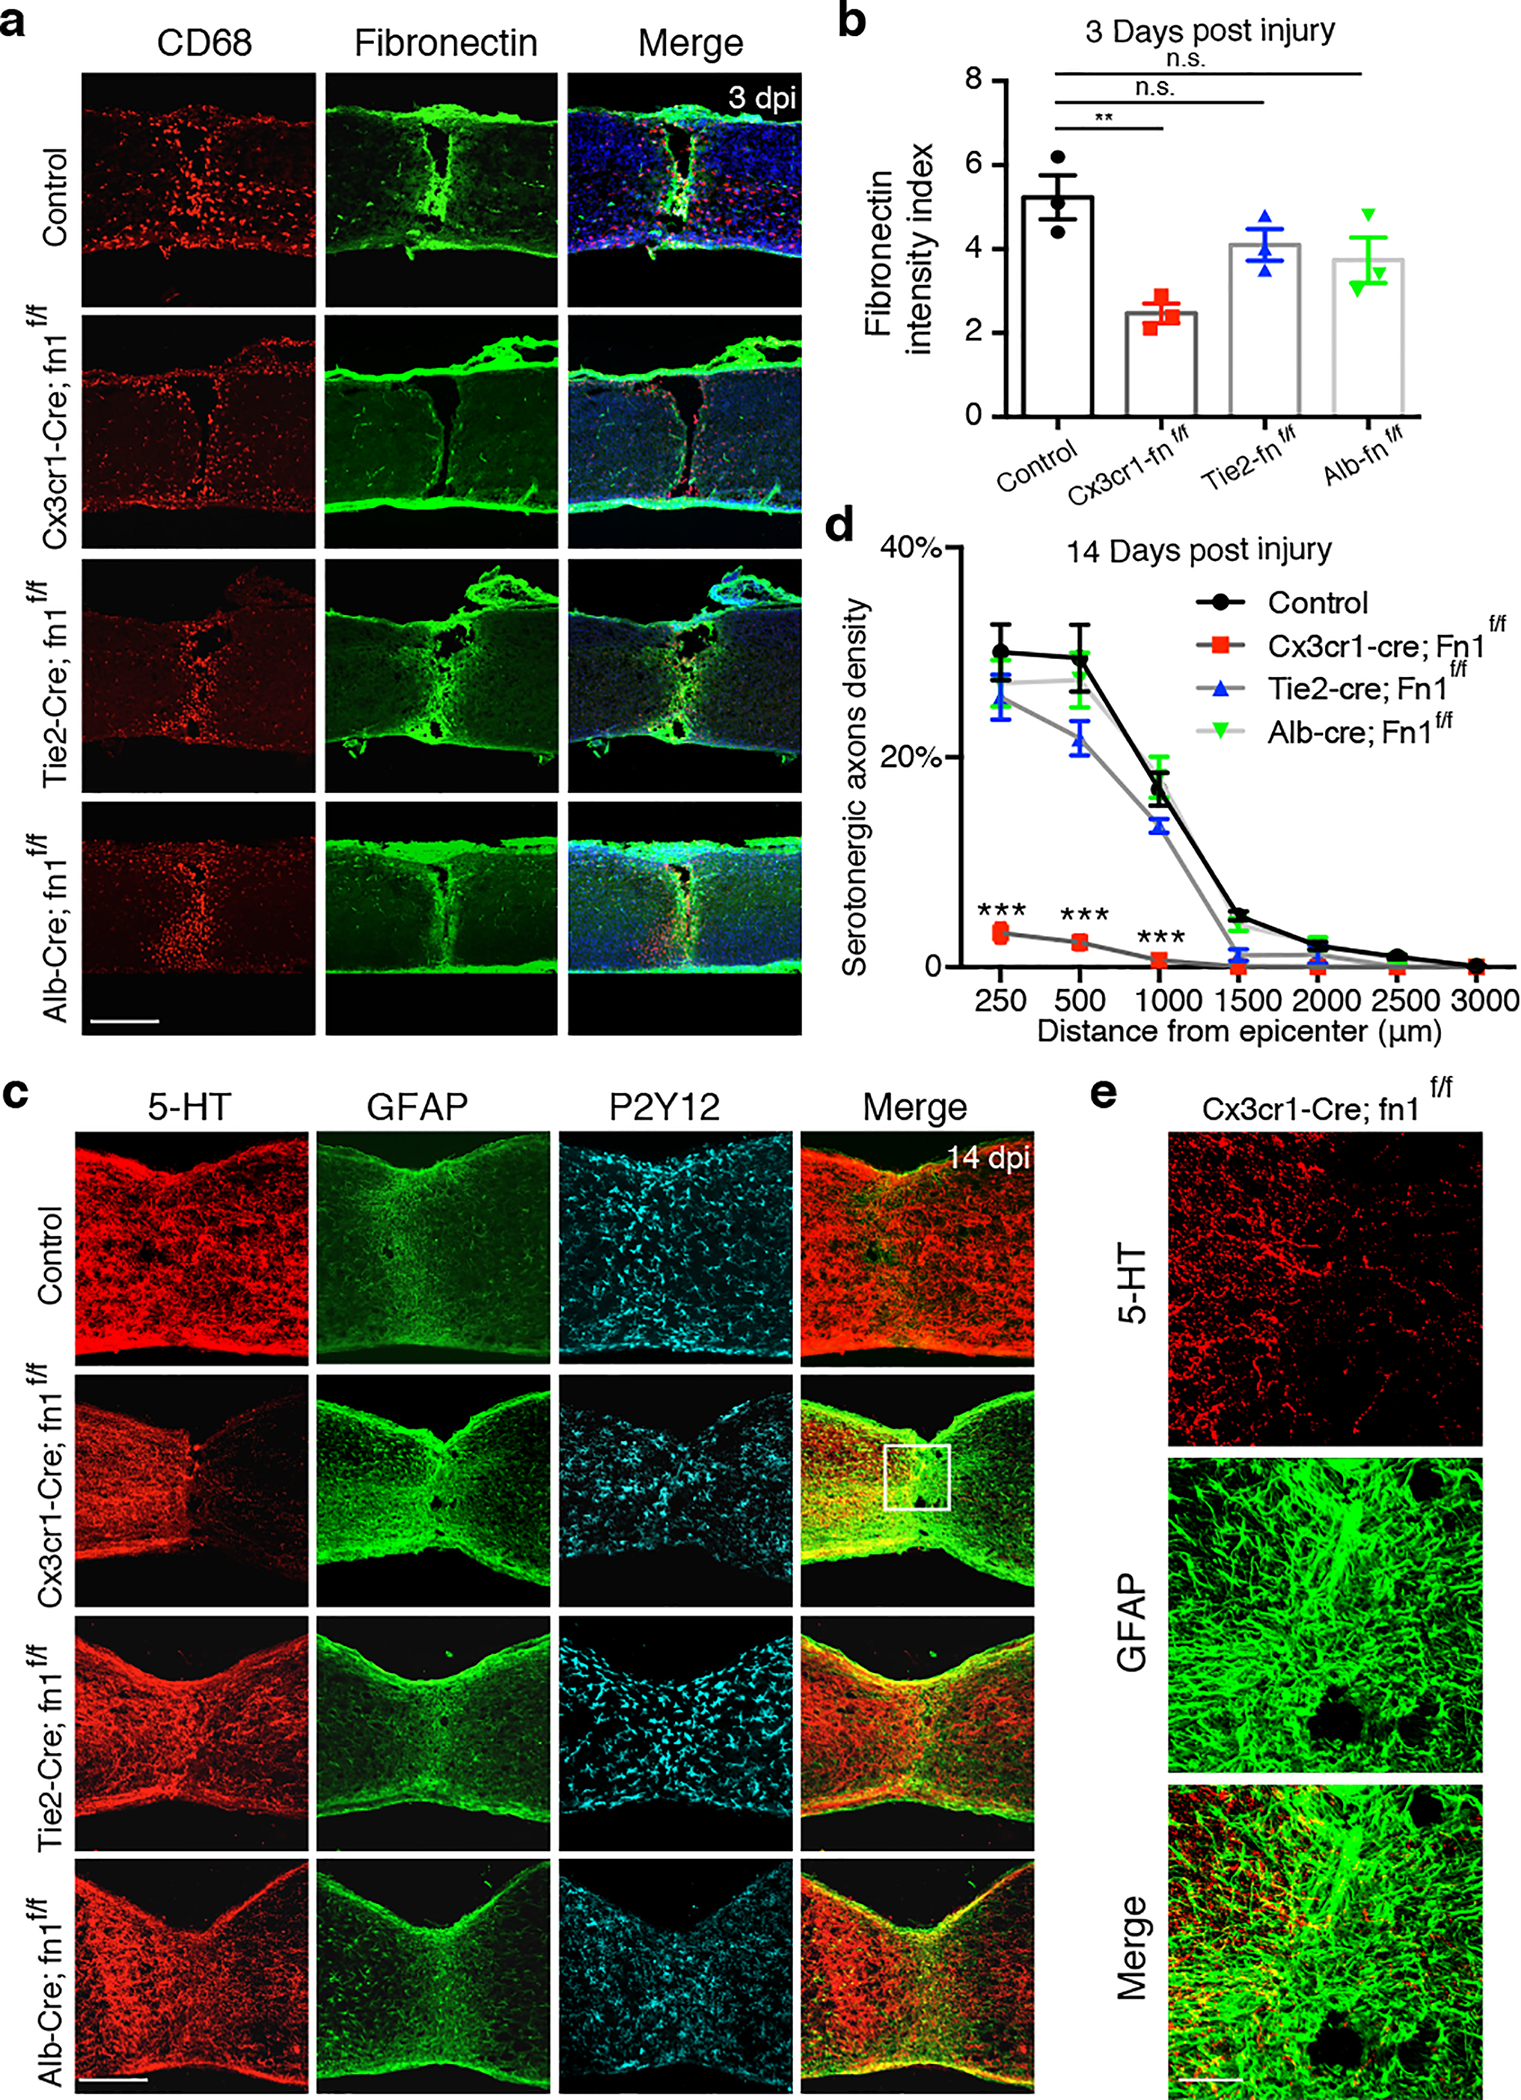
Fig. 4 |. Deletion of fibronectin in microglia impairs wound healing and axon regrowth after P2 injury.

a, Images of spinal sections stained with indicated antibodies taken from 3 dpi of control (Fn1f/f) or different conditional knockout mice. b, Quantification of Fibronectin intensity in the lesion site (3 dpi in P2 injury) in different groups of mice (n=3). One-way ANOVA followed by post hoc Bonferroni correction. **p = 0.0063, n.s., not significant. c, Images of spinal sections stained with antibodies against 5-HT or GFAP, or P2Y12 taken in different groups of mice at 14dpi. d, Quantification of serotonergic axons density (normalized to proximal of lesion) in the spinal cord distal to the lesion (n=5). Two-way ANOVA followed by post hoc Bonferroni correction. ***p < 0.0001. e, Higher magnification images from c, showing 5-HT axon terminals and GFAP+ astrocytes in the lesion site. Data shown as mean ± s.e.m. Scale bar: 250μm (a, c), 50μm (e).
