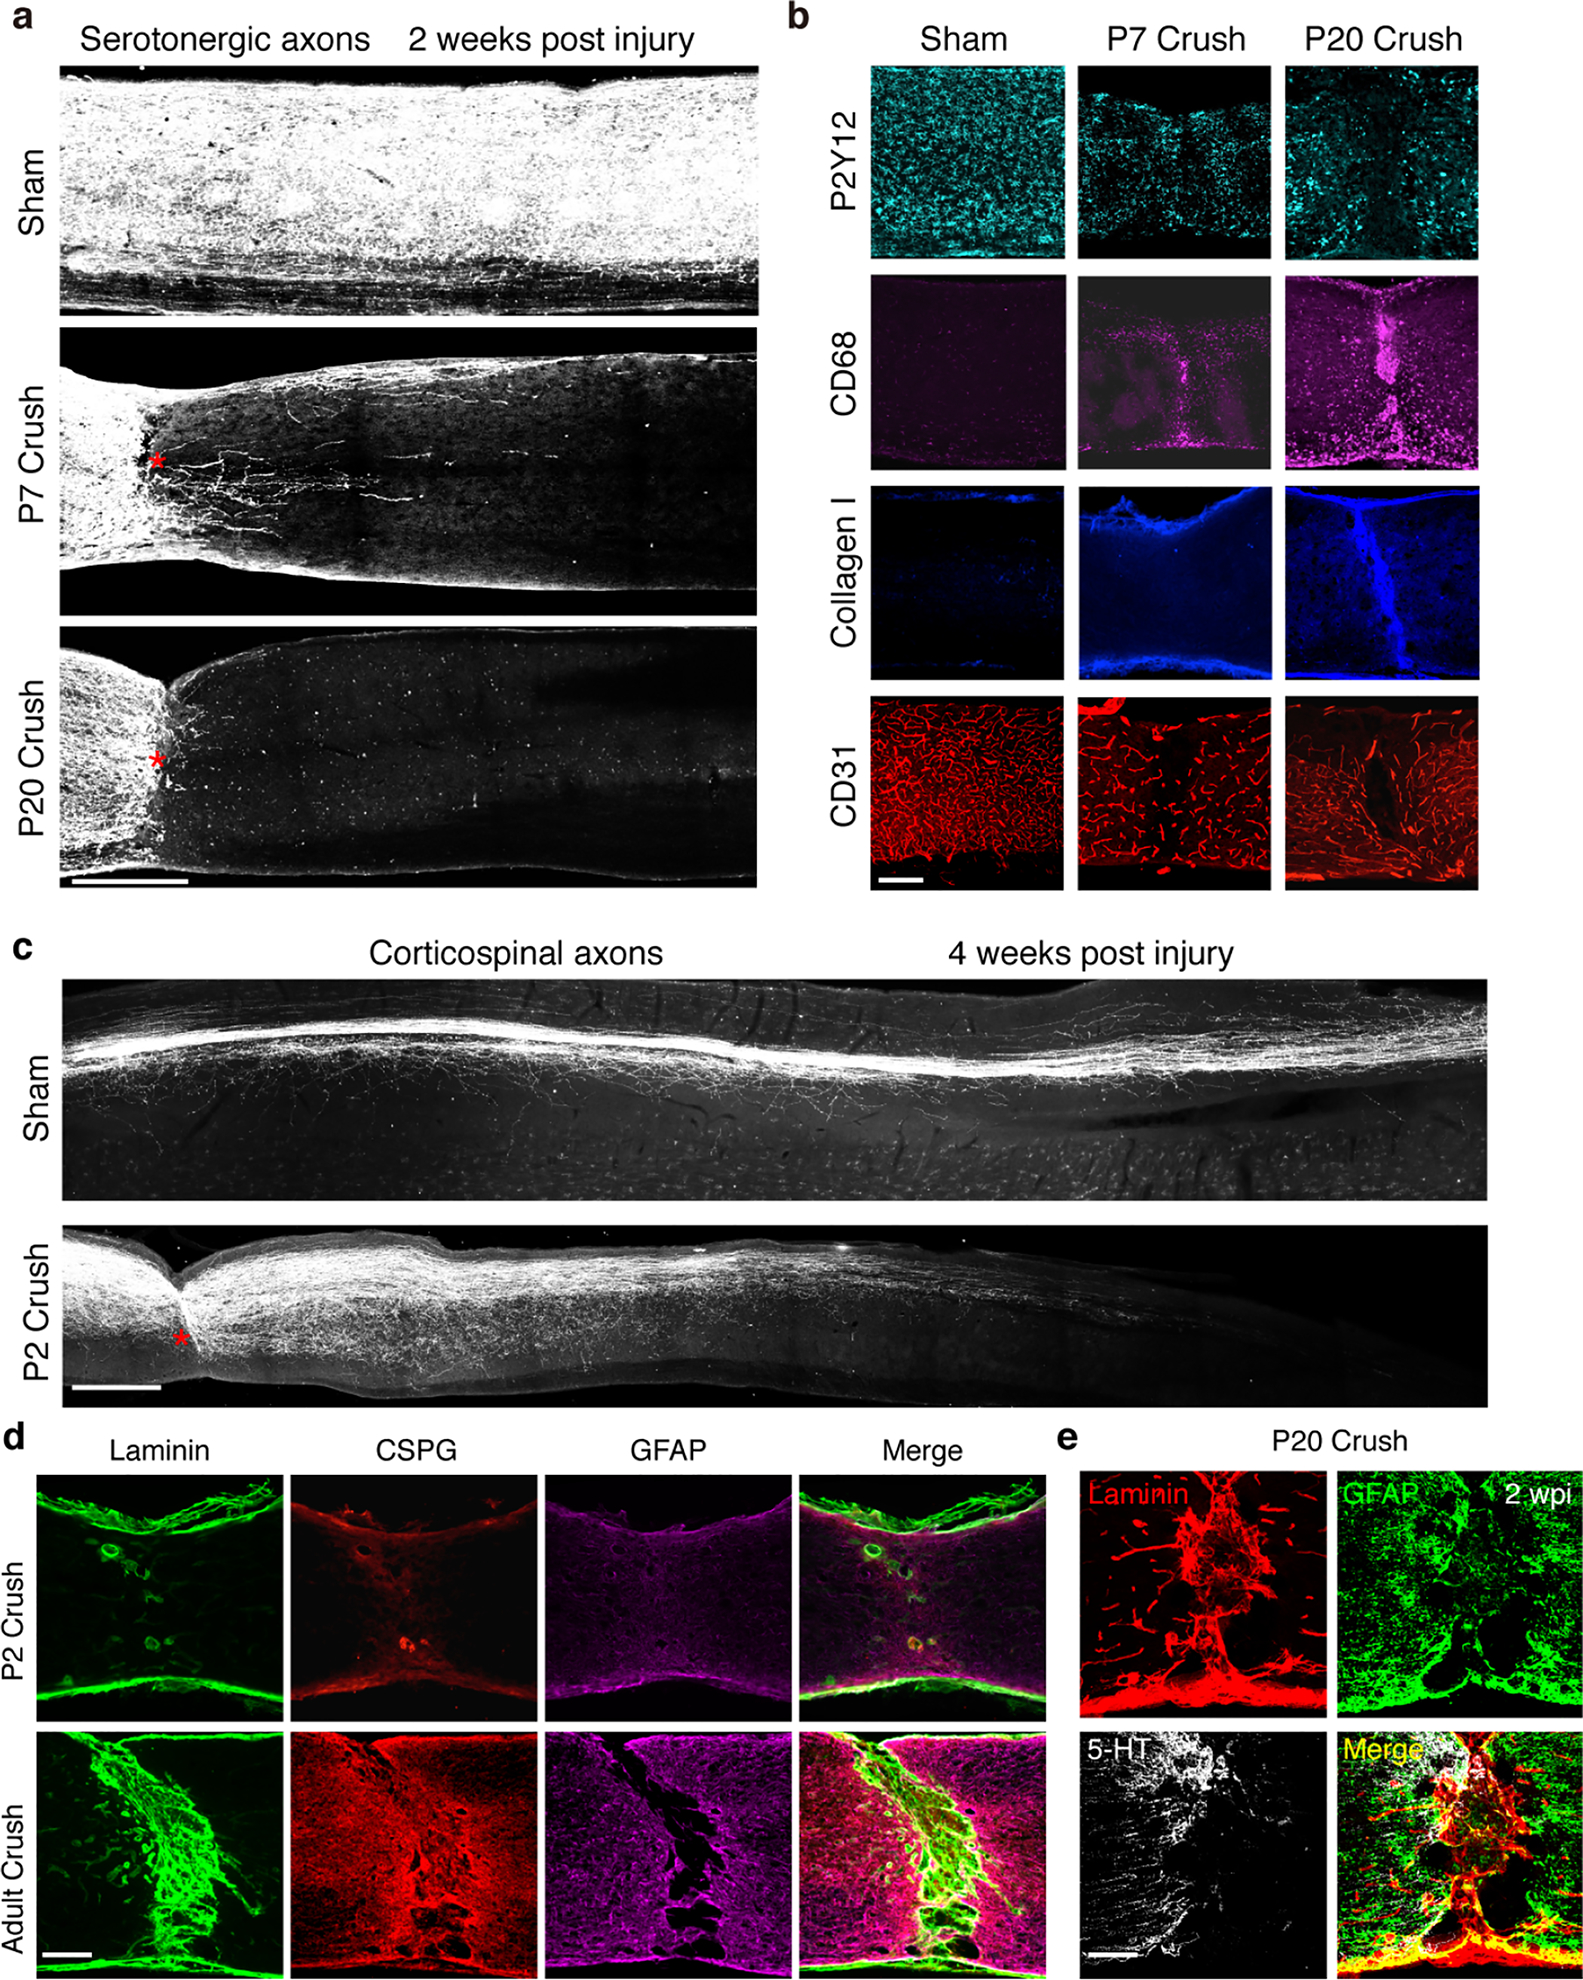
Extended Data Fig.1 |. Age-dependent decline in serotonergic axon regrowth and wound healing.

a, Representative images of the spinal cord sagittal sections showing 5HT-labeled axons from sham, P7 or P20 mice at 2 weeks after crush. Scale bar: 500μm. b, Representative images of the spinal cord sections from sham, P7 or P20 mice at 2 weeks after crush stained with antibodies against Collagen I, CD68, P2Y12 or CD31. Scale bar: 250μm. c, Representative images of spinal sagittal sections at 4 weeks after Sham control or P2 crush stained with corticospinal axon tracing by AAV-ChR2-mCherry. Red stars indicate the lesion site. Scale bar: 500μm. d, Representative images of sagittal spinal cord sections at 2 weeks after crush stained with antibodies against Laminin, CSPG and GFAP, respectively. Scale bar: 250μm. e, Representative images of sagittal spinal cord sections at 2 weeks after P20 crush stained with antibodies against Laminin, CSPG and 5-HT, respectively. Scale bar: 250μm. All experiments shown in this figure were independently repeated 3 times with similar results.
