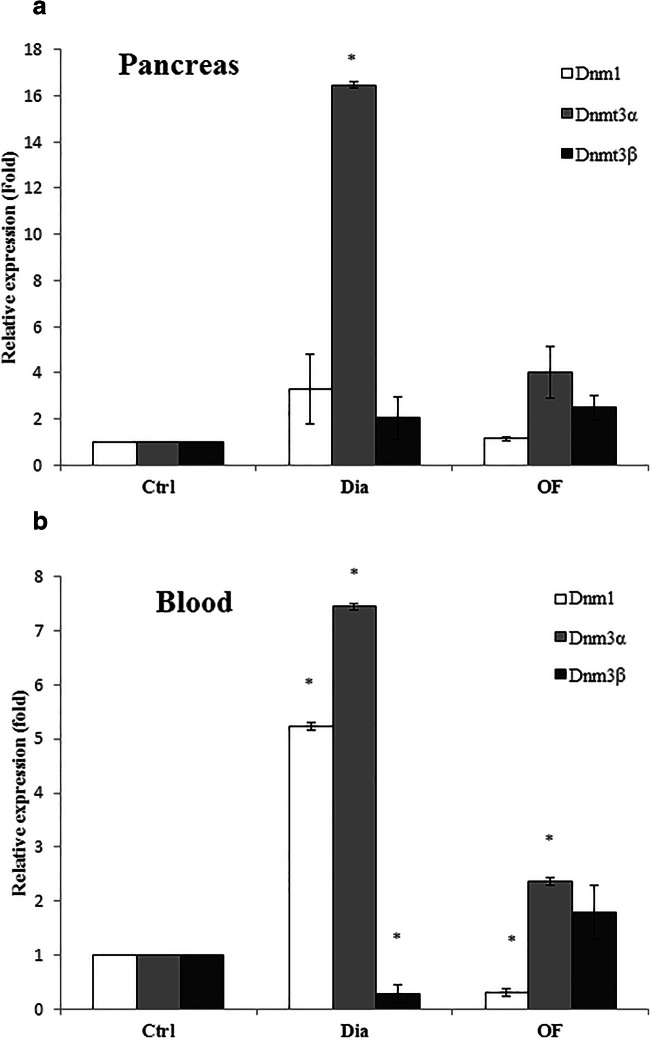
Fig. 3.
The expression levels of DNA methyltransferases (Dnmt1, Dnmt3α and Dnmt3β). RNA was extracted from the peripheral blood (A) and the pancreas (B) of OF (20 mg/kg)- treated and untreated diabetic rats and the expression of DNA methyltransferases were analyzed relative to control group using quantitative real time PCR (qRT-PCR). The results are the mean ± SD of triplicate experiment (P < 0.05). *, significantly different from control group

