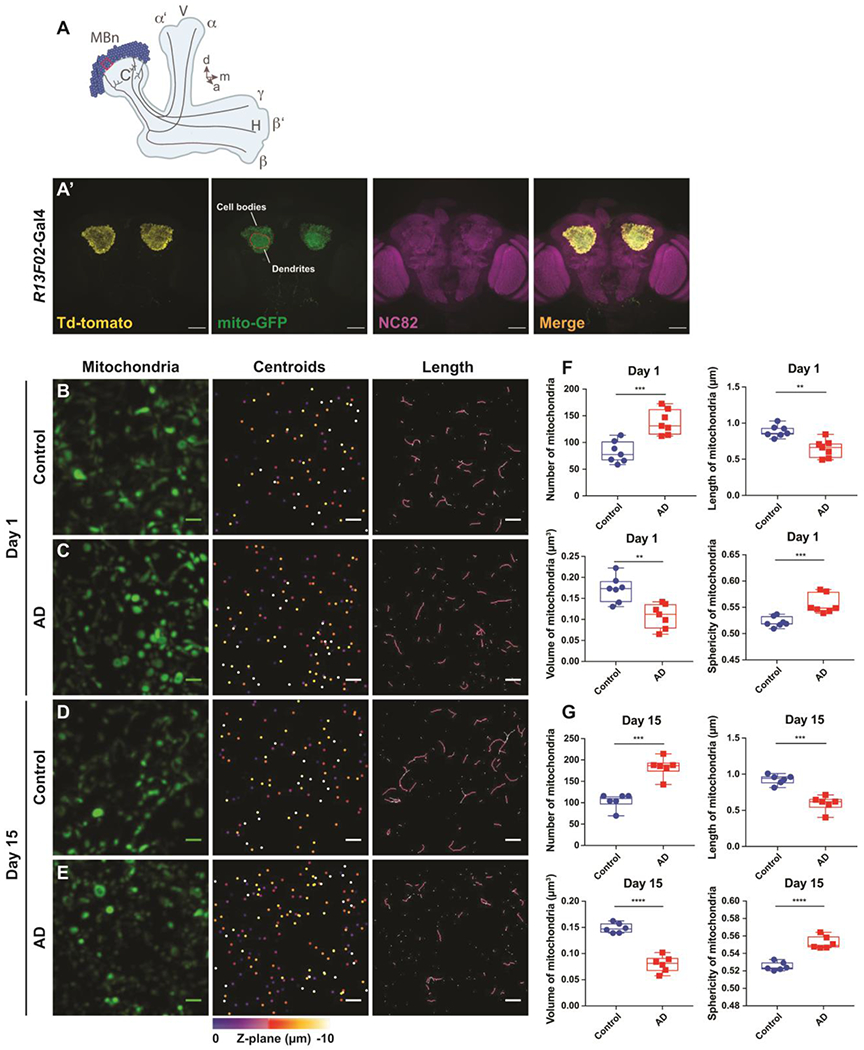
Figure 1. Mitochondrial morphology in the soma of MBn expressing Aβ42.

(A) Diagram of the MB in the fly’s right hemisphere. The somata of the MBn are colored dark blue with their associated neuropil areas colored light blue. The Calyx (C) contains the dendrites of the MBn and the Vertical (V) and Horizontal (H) lobes contain the axons of the MBn. The three major classes of MBn, α/β, α’/β’ and γ, classed according to the projection patterns of their axons, are illustrated along with the associated neuropil to which they project – the α/β lobes, α’/β’ lobes, and γ lobe, respectively. The ten μm3 volume ROI (red box), located at a one o’clock position viewed from a frontal perspective of the calyx in the fly’s left hemisphere (11 o’clock for the right hemisphere), was used to characterize the somatic mitochondria. d=dorsal, m=medial, a=anterior.
(A’) Low resolution maximum projection images of the soma and dendritic regions of the adult MB in both hemispheres. The R13F02-Gal4 expression was visualized using UAS-myr-Td-tomato and UAS-mito-GFP. Brain neuropil was stained with anti-nc82. Scale bar 50 μm.
(B) Maximum projection images of individual mitochondria, mitochondrial centroids and their lengths in a 10 μm3 ROI from the somatic region of a control brain at 1 day-of-age. Genotype: UAS-mito-GFP/+; R13F02-Gal4/+. Scale bar 1 μm.
(C) Same as panel A for an Aβ42-expressing brain at 1 day-of-age. Genotype: UAS-mito-GFP/UAS-Aβ42; R13F02-Gal4/UAS-Aβ42.
(D) Same as panel A for a control brain at 15 days-of-age.
(E) Same as panel C for an Aβ42-expressing brain at 15 days-of-age.
(F) Box plots of somatic mitochondrial parameters in control and Aβ42-expressing flies at 1 day-of-age. mitochondria are more numerous (***P< 0.001), shorter (**P< 0.01) and of reduced volume (**P< 0.01) with increased sphericity (***P< 0.001) in the Aβ42-expressing flies. Mann-Whitney U, n=7. Each box plot shows the median, interquartile range and the range.
(G) Same as panel F for control and Aβ42-expressing flies at 15 days-of-age. Mitochondria are more numerous (***P< 0.001), shorter (***P< 0.001) and of reduced volume (****P< 0.0001) with increased sphericity (****P< 0.0001) in the Aβ42-expressing flies. Mann-Whitney U, n=6.
