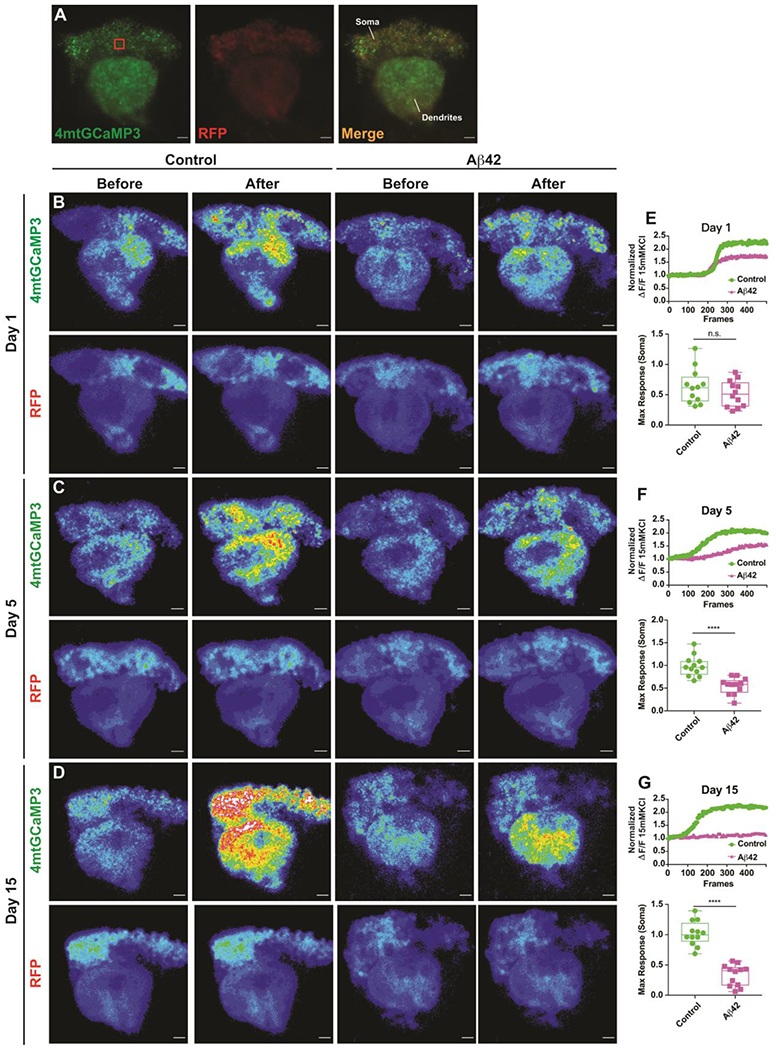
Figure 3. Mitochondrial calcium import is impaired in the MBn of Aβ42-expressing flies.

(A) Maximum projection images showing the expression of UAS-4mtGCaMP3 and UAS-RFP in the MBn ex vivo. The red box in the left panel represents the 10 μm3 volume used to quantify somatic responses. Genotype: UAS-4mtGCaMP3, UAS-RFP /+; R13F02-Gal4/+. Scale bar 50 μm.
(B) Representative pseudocolor images of the mito-GCaMP3 response in the soma and dendrites of MBn for control and Aβ42-expressing flies at 1 day-of-age, before and after stimulation with 15 mM KCl. The bottom row of images illustrates the RFP signal which was used to normalize the mito-GCaMP3 signal. Genotypes: UAS-mito-GCaMP3, UAS-RFP /+; R13F02-Gal4/+; and UAS-4mtGCaMP3, UAS-RFP / UAS-Aβ42; R13F02-Gal4/UAS-Aβ42.
(C) Same as panel B for flies at 5 days-of-age.
(D) Same as panel B for flies at 15 days-of-age.
(E) Quantification of the normalized 4mtGCaMP3 response in the soma of MBn (10 μm3 volume, red box in panel A) of control and Aβ42-expressing flies at 1 day-of-age. The upper panel illustrates a representative response to KCl in the two genotypes. Group data are shown in the lower panel as a box plot of the median, interquartile range, and the range. The maximum response of 4mtGCaMP3 in the Aβ42-expressing flies was depressed but not significantly different from the control. Mann-Whitney U. n=12.
(F) Same as panel E for flies at 5 days-of-age. ****P< 0.0001. n=12. Note also the depressed response in the dendrites.
(G) Same as panel E for flies at days-of-age. ****P< 0.0001. n=12. Note also the depressed response in the dendrites.
