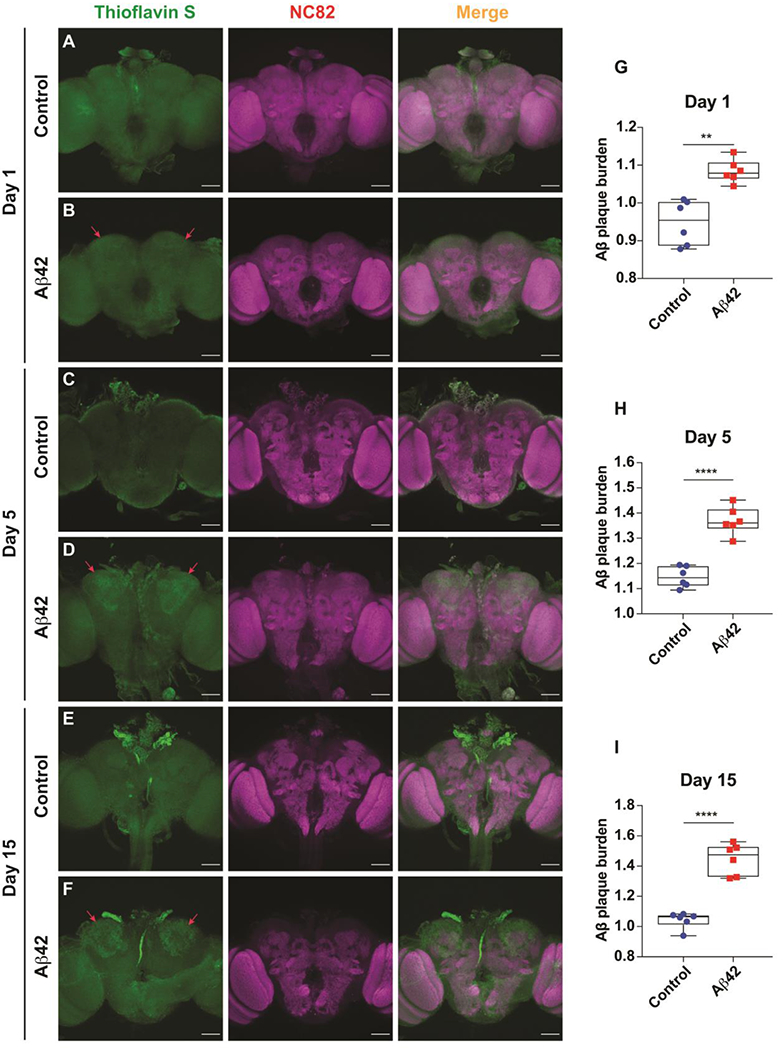
Figure 5. Amyloid plaque formation in the MBn of Aβ42-expressing flies.

(A) Representative maximum projection images of a brain from a control fly at 1 day-of-age co-stained with Thioflavin S and anti-NC82. Genotype: +/+; R13F02-Gal4/+. Scale bar 50 μm.
(B) Representative maximum projection images of a brain from an Aβ42-expressing fly at 1 day-of-age co-stained with Thioflavin S and anti-NC82. Emerging amyloid plaque staining is highlighted by red arrows. Genotype: +/ UAS-Aβ42; R13F02-Gal4/ UAS-Aβ42. Scale bar 50 μm.
(C) Same as panel A for a brain from a control fly at 5 days-of-age.
(D) Same as panel B for a brain from an Aβ42-expressing fly at 5 days-of-age. Amyloid plaque staining is highlighted by red arrows and increasingly visible.
(E) Same as panel A for a brain from a control fly at 15 days-of-age.
(F) Same as panel B for a brain from an Aβ42-expressing fly at 15 days-of-age. Amyloid plaque staining is highlighted by red arrows and robust.
(G) Quantification of amyloid plaque burden in the MBn somata at 1 day-of age. The normalized Thioflavin S staining was significantly increased over the control. Box plots show the median, interquartile range, and the range. Mann-Whitney U, **P<0.01. n=6.
(H) Same as panel G for 5 days-of age. ****P<0.0001. n=6.
(I) Same as panel G for 15 days-of age. ****P<0.0001. n=6.
