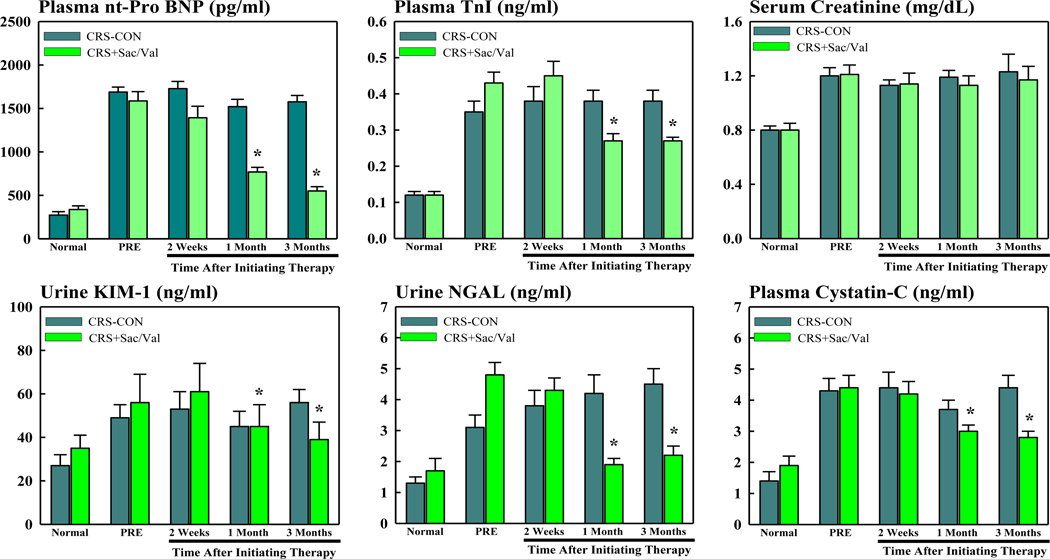
Figure 2.
Bar graphs (mean ± SEM) depicting changes in plasma and urine biomarkers in untreated control cardiorenal syndrome dogs (CRS-CON) (n=7) and in CRS dogs treated with sacubitril/valsartan (CRS+Sac/Val) (n=7). Top left: plasma n-terminal pro-brain natriuretic peptide (nt-pro BNP); Top Middle: plasma troponin-I (TnI); Top Right: serum creatinine; Bottom Left: urine kidney injury molecule-1 (KIM-1); Bottom Middle: urine neutrophil gelatinase associated lipocalin (NGAL); and Bottom Right: plasma cystatin-C. Data time points are when dog was normal, prior to inducting CRS, when dog has experimental CRS but before initiating therapy (PRE) and 2 weeks, 1 month and 3 months after initiating therapy. *=p<0.05 vs. PRE.

