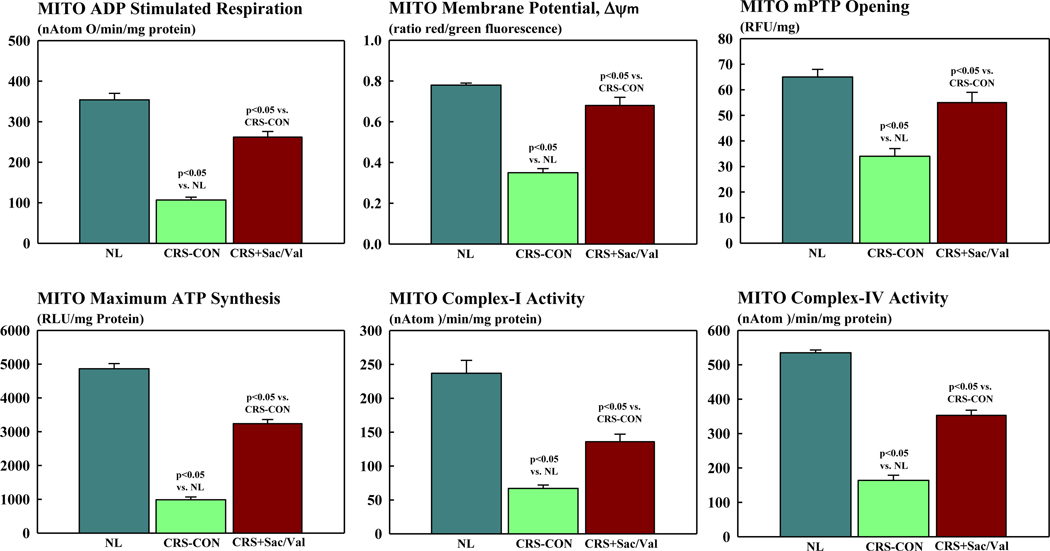
Figure 3.
Bar graphs (mean ± SEM) depicting mitochondrial (MITO) function in cardiomyocytes of left ventricular myocardium of normal (NL) dogs (n=5), untreated control dogs with cardiorenal syndrome (CRS-CON) (n=7) and CRS dogs treated with sacubitril/valsartan (CRS+Sac/Val) (n=7). Top Left: mitochondrial adenosine diphosphate (ADP) stimulated respiration. Top Middle: mitochondrial membrane potential. Top Right: mitochondrial permeability transition pore (mPTP) opening. Bottom Right: mitochondrial maximum rate of adenosine triphosphate (ATP) synthesis; Bottom Middle: mitochondrial complex-activity; Bottom Right: mitochondrial complex-IV activity. Probability values are comparisons between normal dogs, CRS-CON dogs and CRS+Sac/Val treated dogs.

