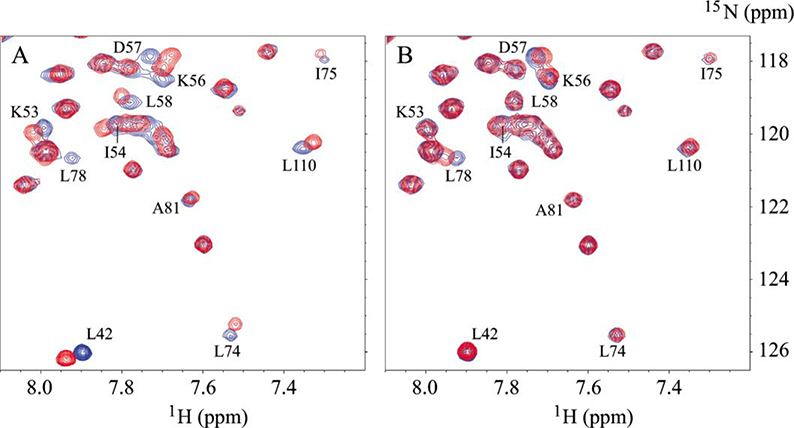
Figure 5. Selected region of 1H-15N HSQC spectra of 15N-S100A10-AnxA2Nter in complexes with Ac-SW and Ac-SW-F/A.
The cross peaks in blue in both A and B are from free 15N-S100A10-AnxA2Nter fusion protein. A: the peaks in red are from the complex in which the molar ratio between Ac-SW and 15N-S100A10-AnxA2Nter is 8.7:1. B: the peaks in red are from the complex in which the molar ratio between Ac-SW-F/A and 15N-S100A10-AnxA2Nter is 10:1. The residues of 15N-S100A10-AnxA2Nter with significant chemical shift perturbation from free to complex with Ac-SW are labeled in both A and B.

