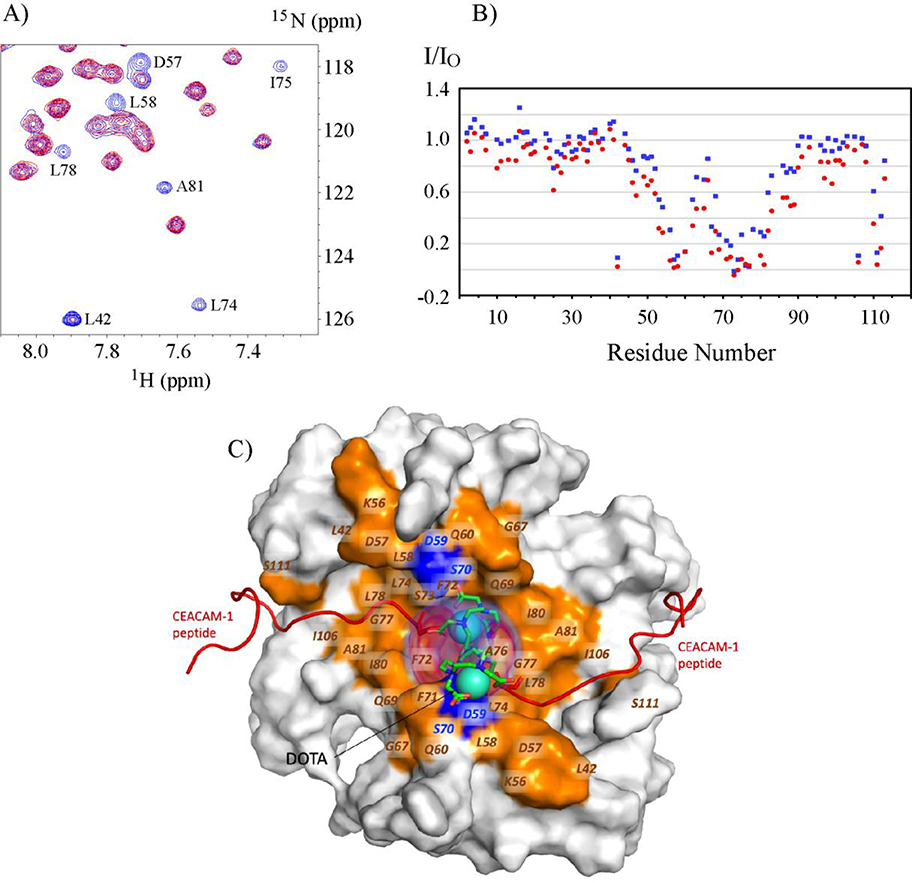
Figure 7. Paramagnetic relaxation enhancement on 15N-S100A10-AnxA2Nter in complexes with Gd-DOTA-SW.
A: Selected 1H-15N HSQC spectra region of 15N-S100A10-AnxA2Nter in complex with Gd-DOTA-SW in which the concentration of Gd-DOTA-SW is 74% of 15N-S100A10-AnxA2Nter. The peaks colored in blue are from free 15N-S100A10-AnxA2Nter sample, and the peaks colored in red are from the complex. Some residues with significant intensity loss in complex are labeled. B: The peak intensity of S100A10-AnxA2Nter in complex with Gd-DOTA-SW (I) versus free S100A10-AnxA2Nter (IO) in two concentration of Gd-DOTA-SW. The data colored in blue and red are from the complex with molar ratio of 0.74:1 and 1.74:1 between Gd-DOTA-SW: S100A10-AnxA2Nter, respectively. C: Surface representation of S100A10-AnxA2Nter showing the bound CEACAM1-SF peptides as red cartoons and the position of the DOTA shown as cyan spheres. The positional density distribution of the two DOTA groups is shown as transparent red volume around the DOTA spheres. The residues in S100A10-AnxA2Nter which show more than 60% decrease in peak intensity in complex with Gd-DOTA-SW vs free S100A10-AnxA2Nter are colored orange and labeled. The peak intensity data for residues colored in blue in the proximity of DOTA group is not available due to either lack of chemical shift assignment or sever peak overlaps.

