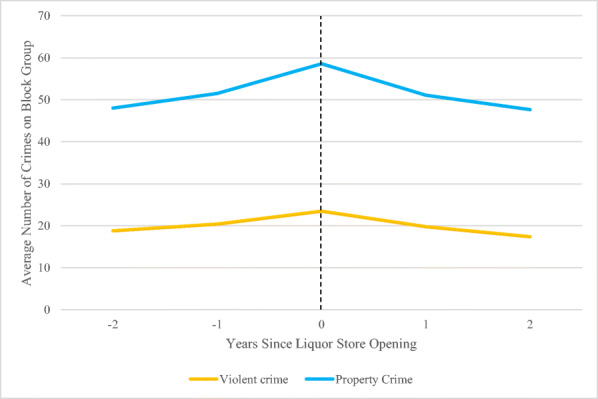
Fig. 5.

Average number of crimes on each block group before and after a liquor store opening (source: author calculations of Baltimore City Crime Data and Baltimore City Liquor store data). Vertical dotted line represents the year in which a liquor store opens. Crime in the year 2015 has been omitted and interpolated since this was the year of the Baltimore riots, which caused some liquor stores to close
