
Figure 4. Br.MAM Subsets Display Divergent and Convergent Phenotypes and Unique Spatial Distributions.
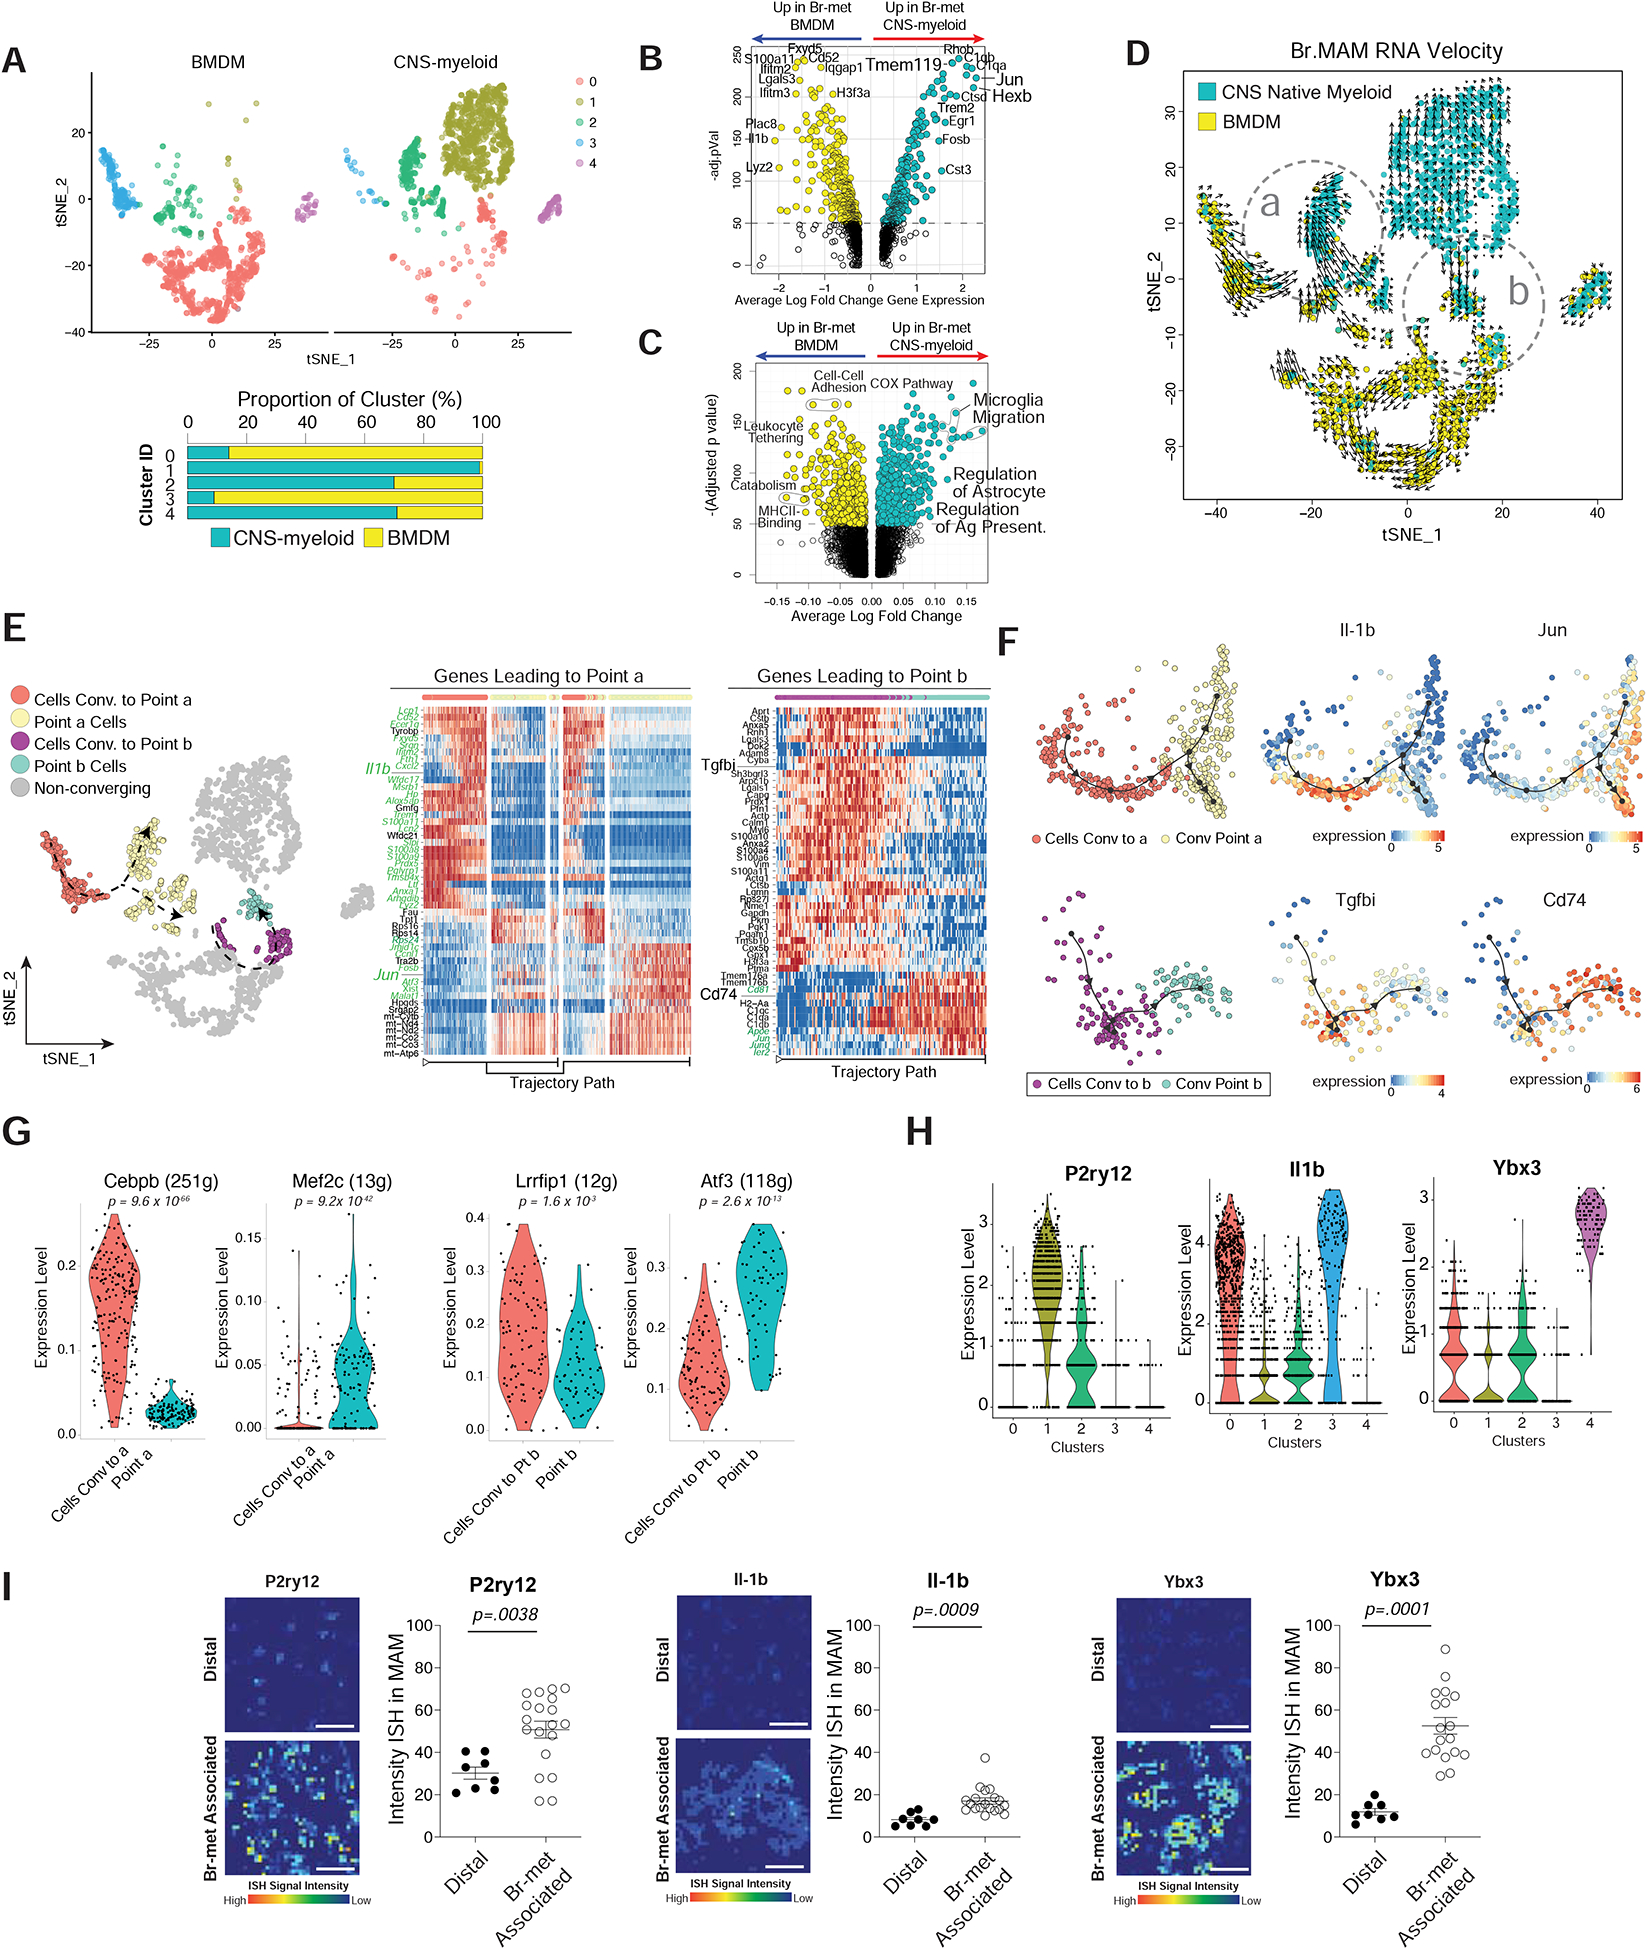
A) tSNE of Br.MAM color coded by transcriptional clusters (top), CNS-myeloid to BMDM ratio within each cluster (bottom).
B-C) Volcano plots showing DEGs (B) and DEGPs (C) between CNS-myeloid and BMDM during br-met.
D) tSNE overlaid with RNA velocity of Br.MAM.
E) tSNE annotated to show cells used for trajectory DEG analysis (left), heatmaps of trajectory DEGs related to point a (middle) and b (right). Genes in green font regulated by transcription factors (TFs) identified in panel (G).
F) Dimensional reduction representation of trajectory overlaid with indicated genes.
G) Violin plots of indicated TFs differentially expressed between cells converging and convergent point cells (each dot represents 1 cell).
H) Violin plots of indicated Br.MAM transcriptional cluster marker genes (each dot represents 1 cell).
I) Heatmaps of ISH intensity within myeloid cells associated with br-mets or distal to br-mets (left), associated quantification of ISH intensity within myeloid cells (each dot represents 1 field of view) (right).
Panels A-H derived from pooling of three biological replicates. Data in B, C, and G analyzed by Wilcoxon rank sum test. Data in I analyzed by two-tailed student’s t test, error bars represent SEM, center represents mean.
See also Tables S5.