
Figure 5. Depletion of the General Myeloid Population and CNS-myeloid Reduces Br-met.
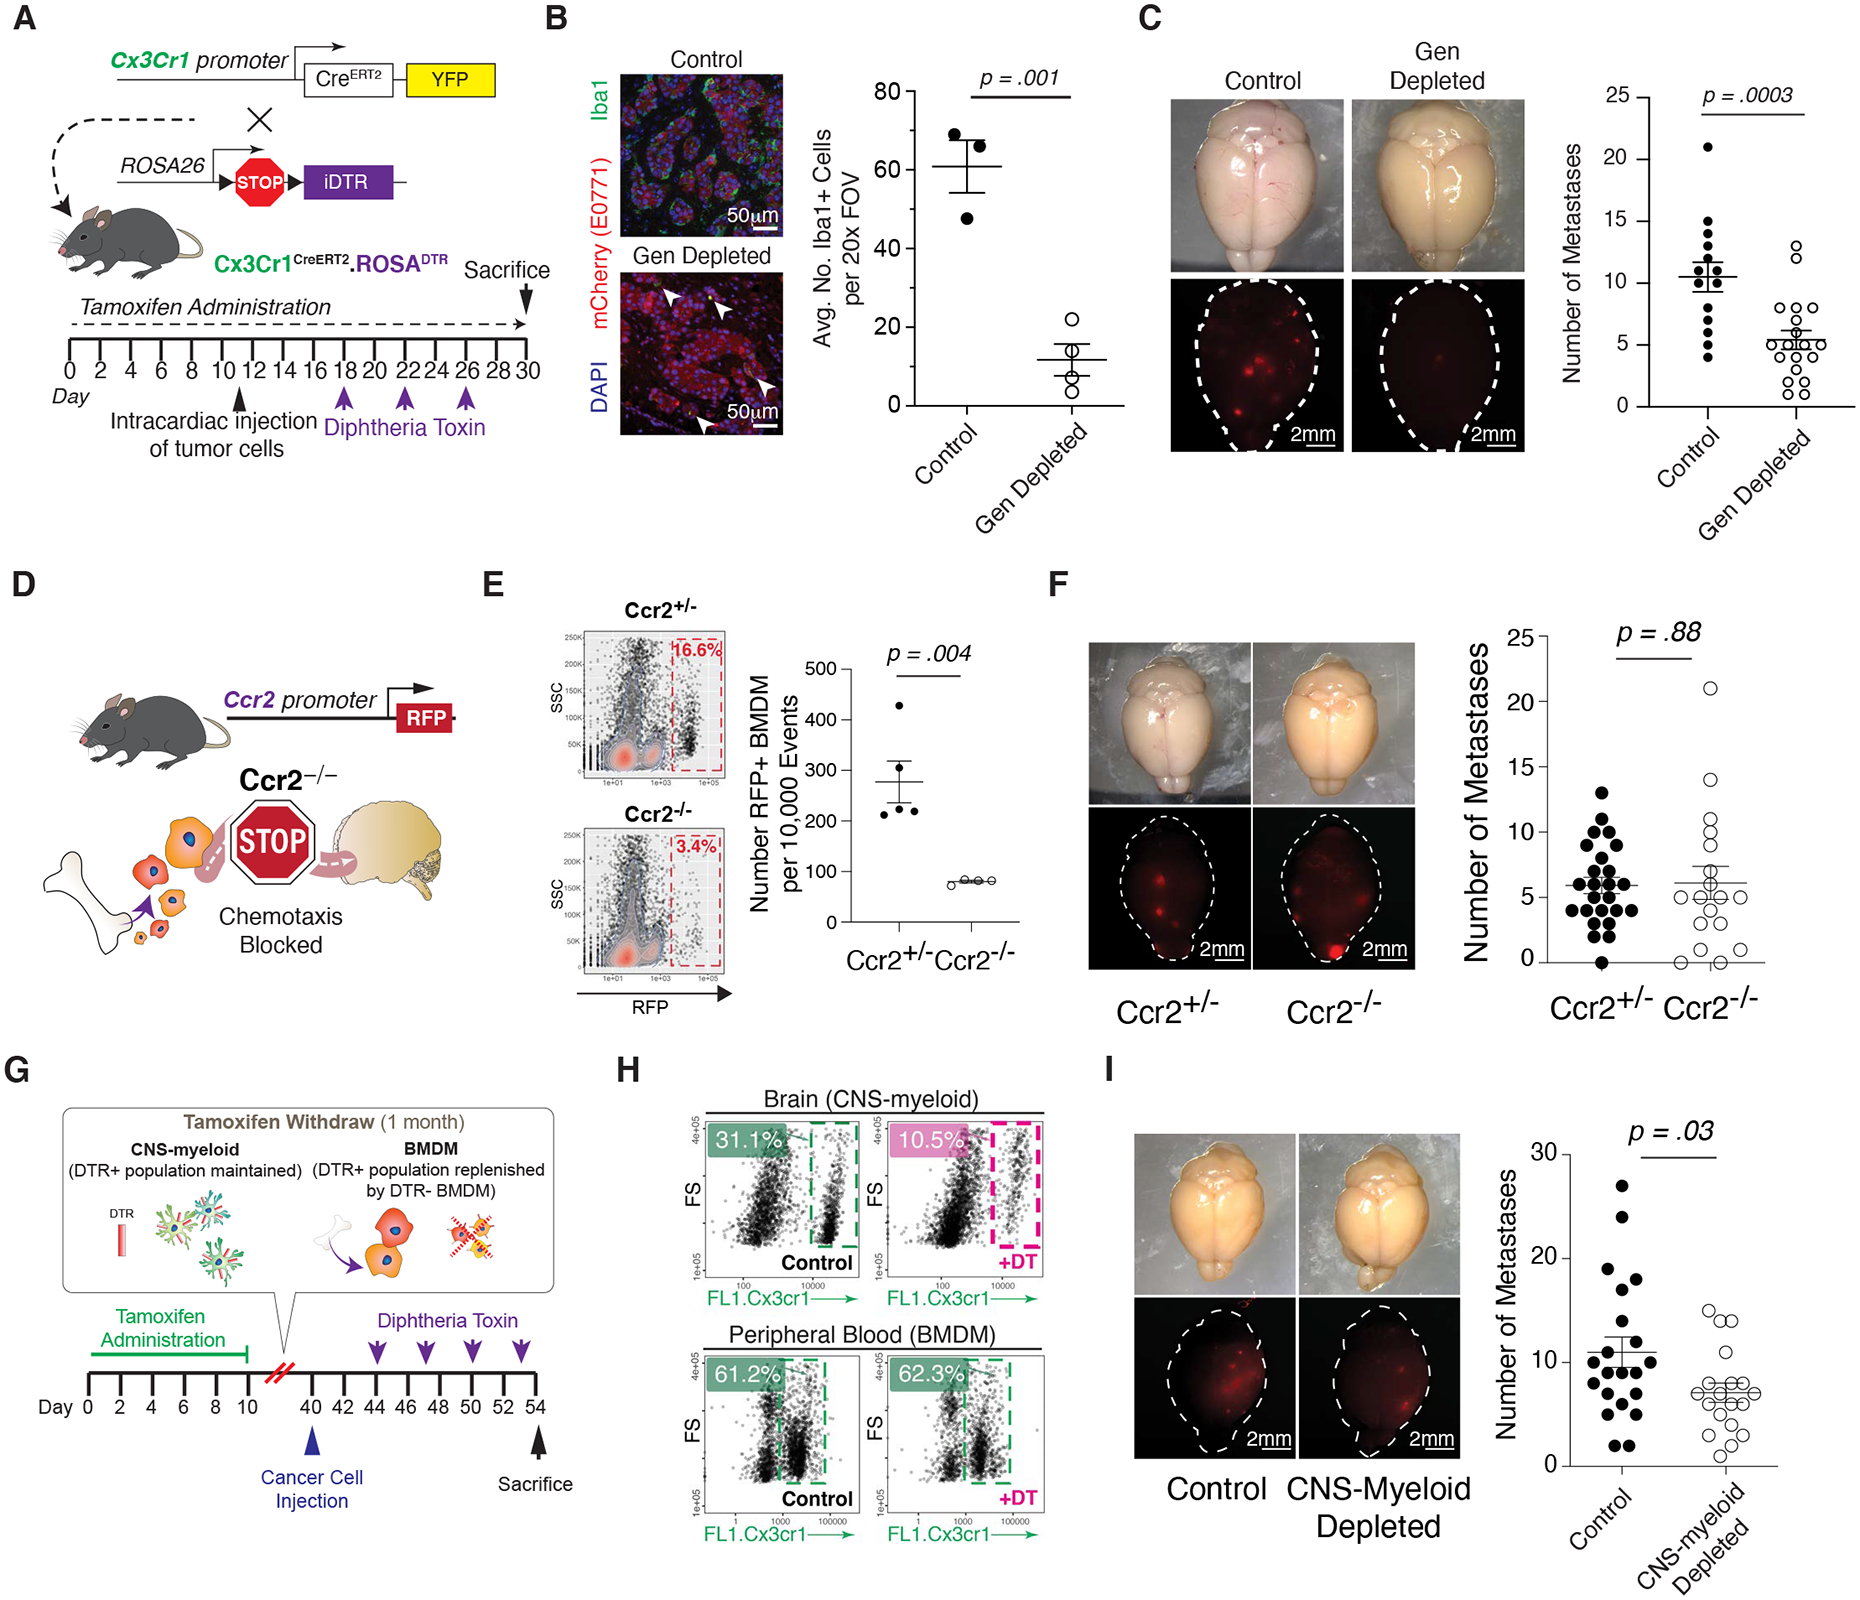
A) Schematic of Cx3cr1CreERT/+ROSAiDTR/+ mouse model.
B) IF of Br.MAM in control and myeloid-depleted mice (left), associated quantification of Iba1+ cells per 20x FOV in brains of control and myeloid-depleted mice during br-mets (each dot represents 1 mouse) (right).
C) Stereoscope images of br-mets in brains of control and myeloid-depleted mice (left), associated quantification of br-met number in control and myeloid-depleted mice (each dot represents 1 mouse; data pooled from two independent experiments with ≥3 mice per group) (right).
D) Schematic of Ccr2−/− mouse model.
E) Biaxial plots of RFP+ BMDM br-met infiltration in Ccr2+/− and Ccr2−/− mice (left), associated quantification (each dot represents 1 mouse; biaxial representative of ≥ 3 biological replicates per group) (right).
F) Stereoscope images of br-mets in brains of Ccr2+/− and Ccr2−/−mice (left), associated quantification of br-met number in Ccr2+/− and Ccr2−/− mice (each dot represents 1 mouse; data pooled from 3 independent experiments with ≥ 3 mice per group) (right).
G) Experimental schematic of CNS-myeloid-exclusive depletion.
H) Biaxial plots comparing Cx3cr1+ cell abundance in brain (top) and blood (bottom) of CNS-myeloid depleted mice relative to controls.
I) Stereoscope images of br-mets in brains of control and CNS-myeloid-depleted mice (left), associated quantification of br-met number in control and CNS-myeloid-depleted mice (each dot represents 1 mouse; quantification based on pooled data from 4 independent experiments with ≥ 4 mice per group) (right).
Data in B, C, E, F, and I analyzed by two-tailed student’s t test and error bars represent SEM, center represents mean.
See also Figures S4–5.