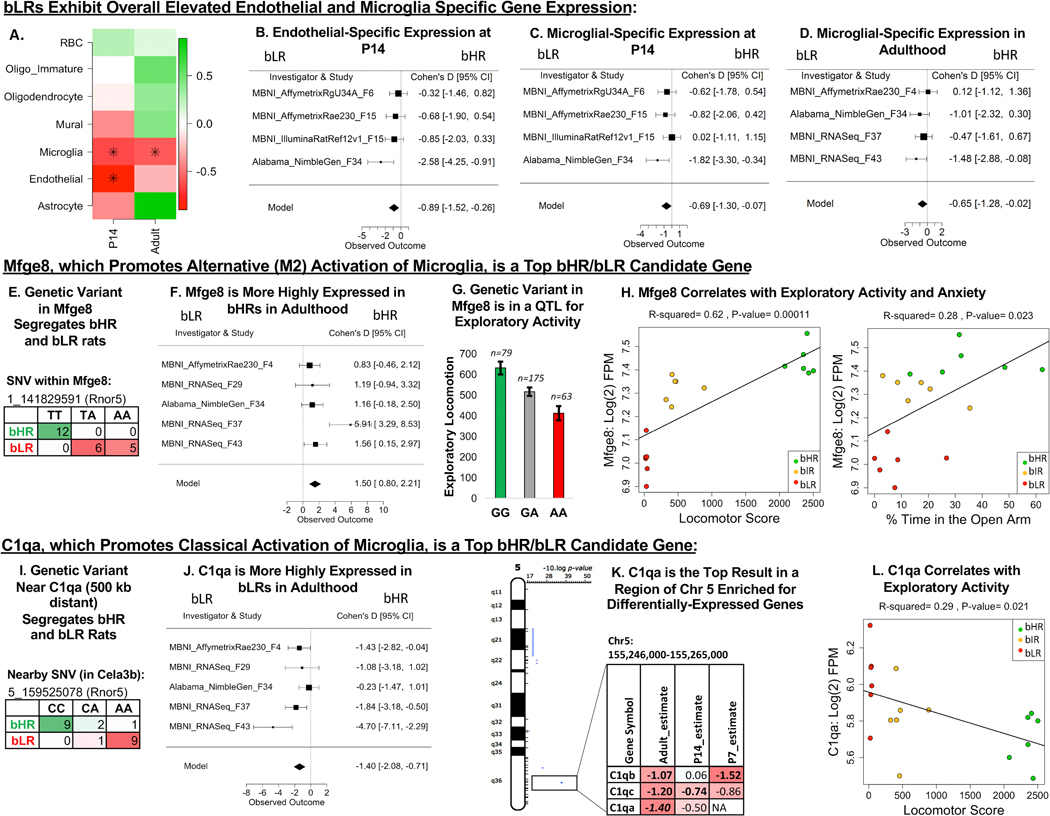
Figure 10.
Microglial-related gene expression differentiates bHR and bLR rats. (A) A heatmap illustrating the effect of bHR/bLR phenotype on cell type–specific gene expression, which can reflect overall cell type balance (51) or activation (green = upregulated in bHRs; red = upregulated in bLRs; an asterisk (*) indicates p < .05). Note that only well-characterized nonneuronal cell type categories were included in this analysis. (B–D) Forest plots (boxes = Cohen’s d from each study ± 95% CIs; Model = estimated effect size ± 95% CIs provided by the meta-analysis) showing an upregulation in bLRs of endothelial-specific gene expression at P14 (β = –0.89, p = 5.75 × 10⁻³) (B) and microglial-specific gene expression at P14 (β = –0.69, p = 2.90 × 10⁻²) (C) and adulthood (β = –0.65, p = 4.47 × 10⁻²) (D). (E) A genetic variant on Chr 1 in Mfge8 segregates bHR and bLR rats in our colony (Fisher’s exact test: p = 7.53 × 10⁻⁸). Mfge8 promotes alternative (M2) activation of microglia. (F) A forest plot illustrating that Mfge8 is more highly expressed in bHRs than in bLRs in the adult meta-analysis in all five adult datasets (β = 1.50, p = 2.70 × 10⁻⁵, FDR = 1.73 × 10⁻²). (G) Mfge8 is located on Chr 1 within a QTL for exploratory locomotor activity. An example of the correlation between genetic variation in this region and behavior is illustrated using the sequencing results from a nearby SNV (Rnor5 coordinates 1_141117448) and exploratory locomotor activity measured in a bHRxbLR F2 intercross (n = 317, adjusted R2 = .061, p = 1.81 × 10⁻⁵, FDR = .002). (H) Within the behavioral data accompanying the MBNI_RNASeq_F37 dataset, Mfge8 [units = log(2) FPM] showed a positive relationship with total locomotor score (β = 0.000146, R2 = .62, p = 1.10 × 10⁻⁴) as well as the percentage time in the open arms of the EPM (β = 0.00603, R2 = .28, p = 2.30 ×10⁻²). (I) A genetic variant on Chr 5 near C1qa (500 kb distant) segregates bHR and bLR rats in our colony (Rnor5 coordinates 5_159525078; Fisher’s exact test: p = 1.09 × 10⁻⁷). C1qa promotes classical activation of microglia via the complement cascade. (J) A forest plot illustrating that C1qa is more highly expressed in bLRs than in bHRs in all five datasets in the adult meta-analysis (β = –1.40, p = 6.57 × 10⁻⁵, FDR = 2.61 × 10⁻²). (K) C1qa is the top DE gene (FDR < .05) within a segment of Chr 5 enriched for DE genes. The table illustrates the DE genes within this region (estimate = estimated effect size [red/negative = higher expression in bLRs]; bold = p < .05; bold + italic = FDR < .05). (L) Within the behavioral data accompanying the MBNI_RNASeq_F37 dataset, C1qa showed a negative relationship with total locomotor score (C1qa: β = –5.17 × 10⁻⁴, R2 = .29, p = 2.09 × 10⁻²). bHR, bred high-responder; bLR, bred low-responder; Chr, chromosome; CI, confidence interval; EPM, elevated plus maze; FDR, false discovery rate; FPM, fragments per million; P, postnatal day; QTL, quantitative trait locus; RBC, red blood cells; SNV, single nucleotide variant.

