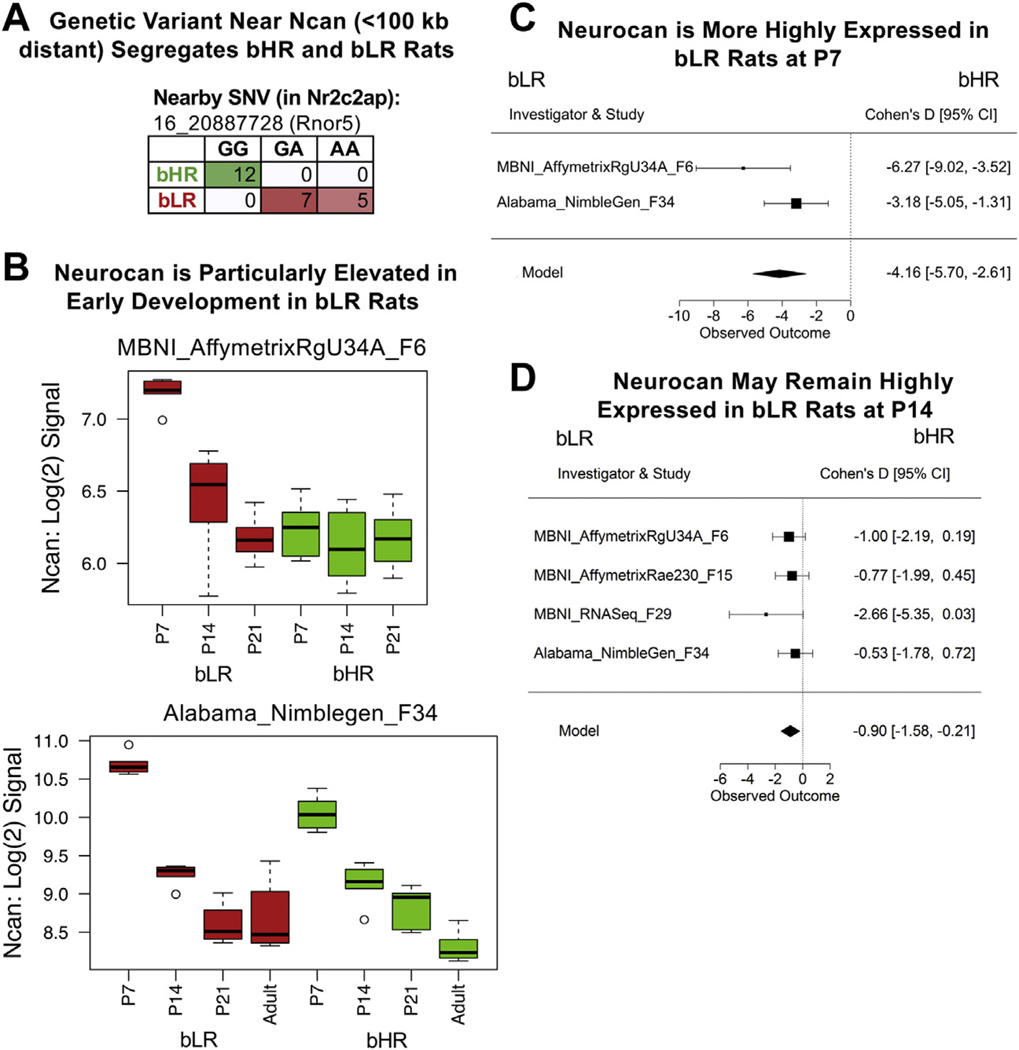
Figure 4.
The extracellular matrix constituent Ncan (neurocan) has elevated expression in bLR rats at P7. (A) A genetic variant on chromosome 16 nearby Ncan (˂100 kb) segregated bHR and bLR rats (Fisher’s exact test: p = 1.63 × 10⁻⁷). (B) Box-plots illustrating the effect of age and bHR/bLR phenotype on Ncan expression [log(2) signal] in 2 microarray studies (boxes = median and interquartile ranges; whiskers = range; red = bLR; green = bHR). The effect of phenotype is most obvious at an age when Ncan is elevated in development (P7). (C, D) Forest plots showing that Ncan was more expressed in bLRs than in bHRs (boxes = Cohen’s d from each study ± 95% CIs; Model = estimated effect size ± 95% CIs provided by the meta-analysis) in the P7 meta-analysis (β = 24.16, p = 1.38 × 10⁻⁷, FDR = 4.86 × 10⁻⁴) (C) and nominally in the P14 meta-analysis (β = 0.90, p = 1.01 × 10⁻², FDR = 7.24 × 10⁻¹) (D). bHR, bred high-responder; bLR, bred low-responder; CI, confidence interval; FDR, false discovery rate; P, postnatal day; SNV, single nucleotide variant.

