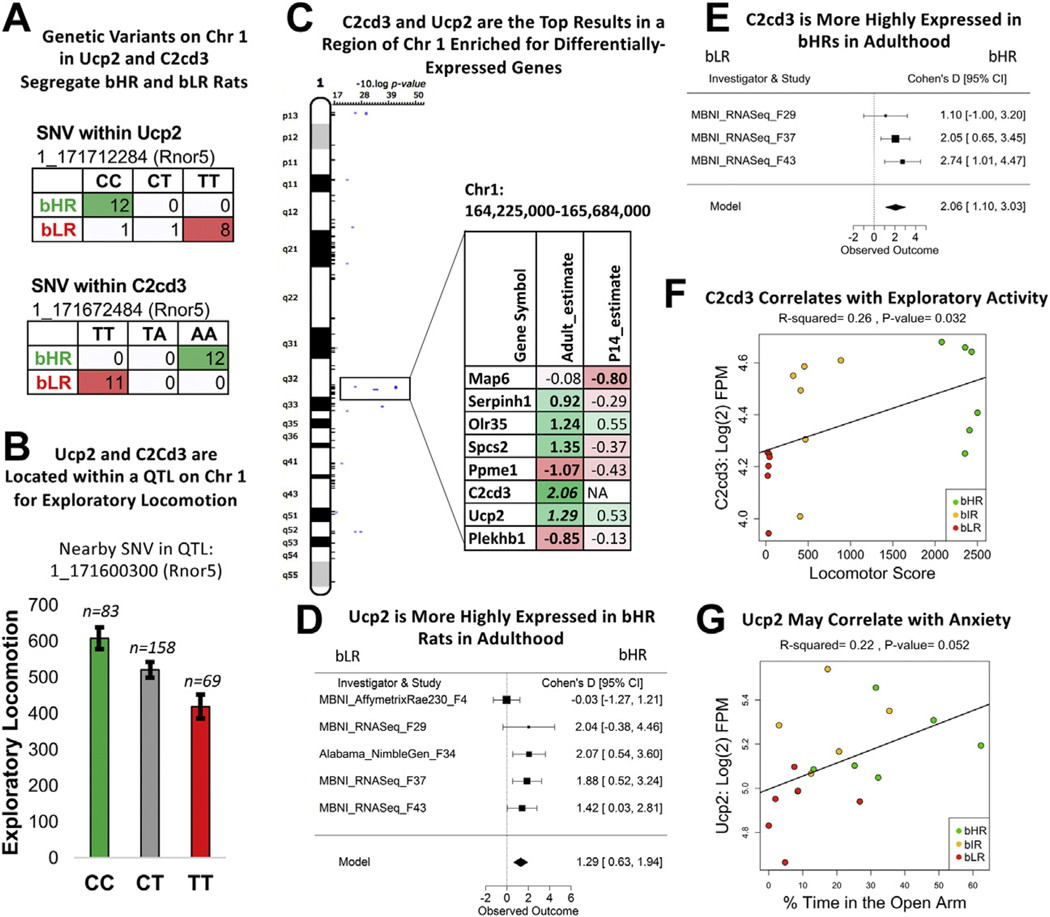
Figure 7.
A region on Chr 1 implicated in the bHR/bLR phenotype contains two genes important for brain function and development: Ucp2 and C2cd3. (A) Genetic variants on Chr 1 within Ucp2 and C2cd3 segregate bHR and bLR rats in our colony (Rnor5 coordinates, Fisher’s exact test: SNV 1_171712284: p = 1.66 × 10⁻⁹; SNV 1_171672484: p = 1.27 × 10⁻¹³). (B) Ucp2 and C2cd3 are located on Chr 1 within a QTL for exploratory locomotor activity. An example of the correlation between genetic variation in this region and behavior is illustrated using the sequencing results from a nearby SNV and exploratory locomotor activity measured in a bHR×bLR F2 intercross (n = 310; adjusted R2 = .049, p = 2.00 × 10⁻⁴, FDR = .0048). (C) C2cd3 and Ucp2 were the top DE genes (FDR < .05) within a segment of Chr 1 enriched for DE genes and containing a QTL for exploratory locomotor activity (25). The table illustrates the DE genes within this region. Estimate shows the estimated effect size (green/positive = higher expression in bHRs). Bold = p < .05, and bold + italic = FDR < .05. (D) A forest plot showing that Ucp2 had higher expression in bHRs in 4 of the 5 adult datasets included in the adult meta-analysis (boxes = Cohen’s d from each study ± 95% CIs; Model = estimated effect size ± 95% CIs provided by the meta-analysis; effect of phenotype: β = 1.29, p = 1.27 × 10⁻⁴, FDR = 3.83 × 10⁻²). This direction of effect mirrors findings in the literature showing that Ucp2 knockout mice have higher anxiety-like behavior and lower locomotor activity as well as greater sensitivity to stress (66,67,69,70), much like our bLR rats. (E) A forest plot showing that C2cd3 had higher expression in bHRs in 3 adult datasets included in the adult meta-analysis (effect of phenotype: β = 2.06, p = 2.84 × 10⁻⁵, FDR = 1.73 × 10⁻²). (F) In the behavioral data accompanying the MBNI_RNASeq_F37 dataset, C2cd3 [units: log(2) FPM] showed a positive relationship with exploratory locomotor activity (β = 0.000109, R2 = .26, p = 3.20 × 10⁻²). (G) In the behavioral data accompanying the MBNI_RNASeq_F37 dataset, Ucp2 showed a trend toward a positive relationship with percentage of time spent in the anxiogenic open arms of the EPM (β = 0.03, R2 = .22, p = 5.16 × 10⁻²). bHR, bred high-responder; bIR, bred intermediate-responder; bLR, bred low-responder; Chr, chromosome; CI, confidence interval; DE, differentially expressed; EPM, elevated plus maze; FDR, false discovery rate; FPM, fragments per million; QTL, quantitative trait locus; SNV, single nucleotide variant.

