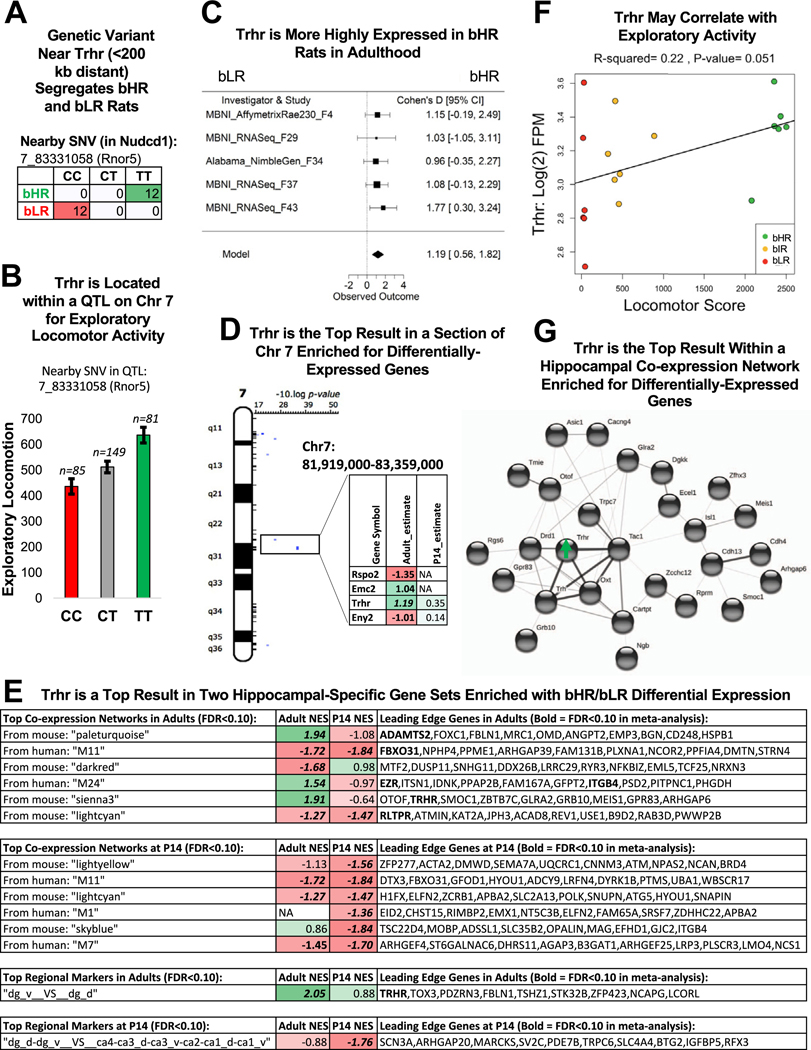
Figure 8.
Trhr was the top gene within 2 hippocampal-specific gene sets and within a region of Chr 7 implicated in the bHR/bLR phenotype. (A) A genetic variant on Chr 7 nearby Trhr (<200 kb distant) segregates bHR and bLR rats in our colony (Fisher’s exact test: p = 6.20 × 10⁻¹⁴). (B) Trhr is located on Chr 7 within a QTL for exploratory locomotor activity. An example of the correlation between genetic variation in this region and behavior is illustrated using the sequencing results from an SNV nearby Trhr (discussed above) and exploratory locomotor activity measured in a bHR×bLR F2 intercross (n = 315, adjusted R2 = .061, p = 5.79 × 10⁻⁵, FDR = .00178). (C) A forest plot showing that Trhr expression was consistently elevated in bHR rats since generation F4 (boxes = Cohen’s d from each study ± 95% CIs; Model = estimated effect size ± 95% CIs provided by the meta-analysis; β = 1.19, p = 2.16 × 10⁻⁴, FDR = 4.94 × 10⁻²). This direction of effect mirrors findings in the literature showing that Trhr knockout mice exhibit greater anxiety and depressive-like behavior (71). (D) Trhr was the strongest result within a segment of Chr 7 enriched for DE genes and overlapping a QTL for exploratory locomotor activity. The table illustrates the DE genes within this region (estimate = estimated effect size [green/positive = greater expression in bHRs]; bold = p < .05; bold + italic = FDR < .05). (E) Trhr was a leading gene in 2 of the top hippocampal-specific gene sets identified as enriched for bHR/bLR DE genes by GSEA (bold = p < .05 in GSEA results; bold + italic = FDR < .05 in GSEA results; NES: positive scores [green] indicate higher expression in bHRs and negative scores [red] indicate higher expression in bLRs). The top 10 leading edge genes for each gene set are shown (bold + italic = FDR < .05 in meta-analysis). These genes have large estimated effect sizes within the meta-analysis and help to drive the enrichment of effects within these gene sets. Regional marker gene sets use the following abbreviations: dg, dentate gyrus; v, ventral; d, dorsal; ca, cornu ammonis subregion. (F) In the behavioral data accompanying the MBNI_RNA-Seq_F37 dataset, Trhr [units: log(2) FPM] showed a trend toward a positive relationship with exploratory locomotor activity (β = 4.48 × 10⁻⁴, R2 = .22, p = 5.08 × 10⁻²). (G) Trhr and its ligand, Trh, are hub genes within a hippocampal-specific coexpression network that is enriched for bHR-upregulated genes. Genes within this network with known protein–protein interactions are illustrated above (STRINGdb: confidence setting = .15 due to hippocampal coexpression already suggesting potential interaction). Many of these genes have documented associations with reward behavior. bHR, bred high-responder; bIR, bred intermediate-responder; bLR, bred low-responder; Chr, chromosome; CI, confidence interval; DE, differentially expressed; FDR, false discovery rate; FPM, fragments per million; GSEA, gene set enrichment analysis; NA, not applicable; NES, normalized enrichment score; QTL, quantitative trait locus; SNV, single nucleotide variant.

