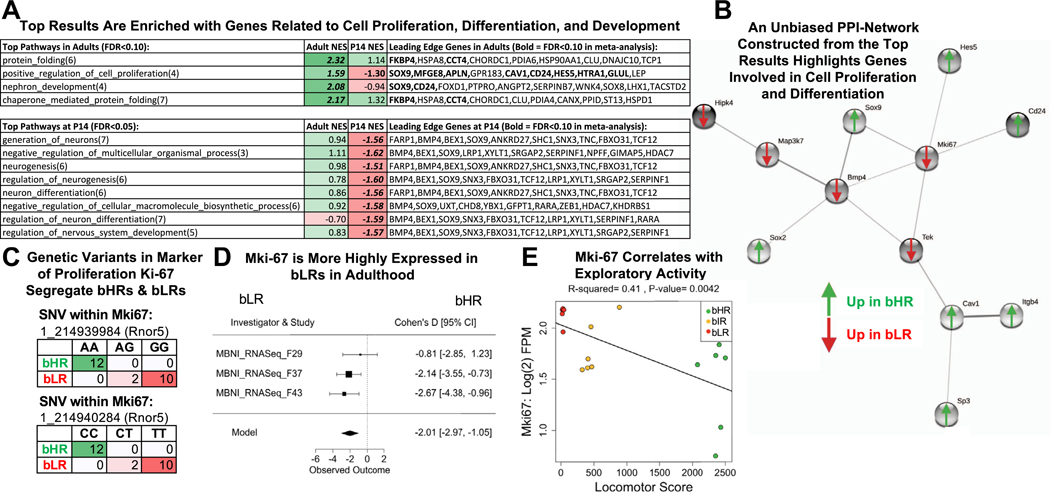
Figure 9.
The top bHR vs. bLR DE results are enriched with genes related to cell proliferation, differentiation, and development, including the canonical Mki67. (A) A table of the top functional ontology gene sets identified as enriched for bHR/bLR DE genes by GSEA (bold = p < .05 in GSEA results; bold + italic = FDR < .05 in GSEA results; NES: positive scores [green] indicate higher expression in bHRs and negative scores [red] indicate higher expression in bLRs). The top 10 leading edge genes for each gene set are shown (bold + italic = FDR < .05 in meta-analysis). These genes have large estimated effect sizes within the meta-analysis and help to drive the enrichment of effects within these gene sets. (B) A PPI network constructed using the top genes from the adult meta-analysis (192 genes with FDR < .10; STRINGdb: confidence setting = .40) had a dominant subnetwork that included Bmp4 and Mki67 as hub genes. Many of these genes are related to cell proliferation and differentiation within the brain. (C) Two genetic variants on Chr 1 within Mki67 fully segregated bHR and bLR rats in our colony (Rnor5 coordinates, Fisher’s exact test: SNV 1_214939984: p = 2.02 × 10⁻¹¹; SNV 1_214940284: p = 2.02 × 10⁻¹¹). (D) A forest plot showing that Mki67 was consistently elevated in bLR rats in adulthood (boxes = Cohen’s d from each study ± 95% CIs; Model = estimated effect size ± 95% CIs provided by the meta-analysis; adult: β = 22.01, p = 4.03 × 10⁻⁵, FDR = 1.99 × 10⁻²). (E) Within the behavioral data accompanying the MBNI_RNA-Seq_F37 dataset, Mki67 [units = log(2) FPM] showed a negative relationship with locomotor score (β = 20.000249, R2 = .41, p = .0042). bHR, bred high-responder; bLR, bred low-responder; Chr, chromosome; CI, confidence interval; DE, differentially expressed; FDR, false discovery rate; FPM, fragments per million; GSEA, gene set enrichment analysis; NES, normalized enrichment score; P, postnatal day; PPI, protein–protein interaction; SNV, single nucleotide variant.

