
Figure 1. Overview and assessment of nanoNOMe.
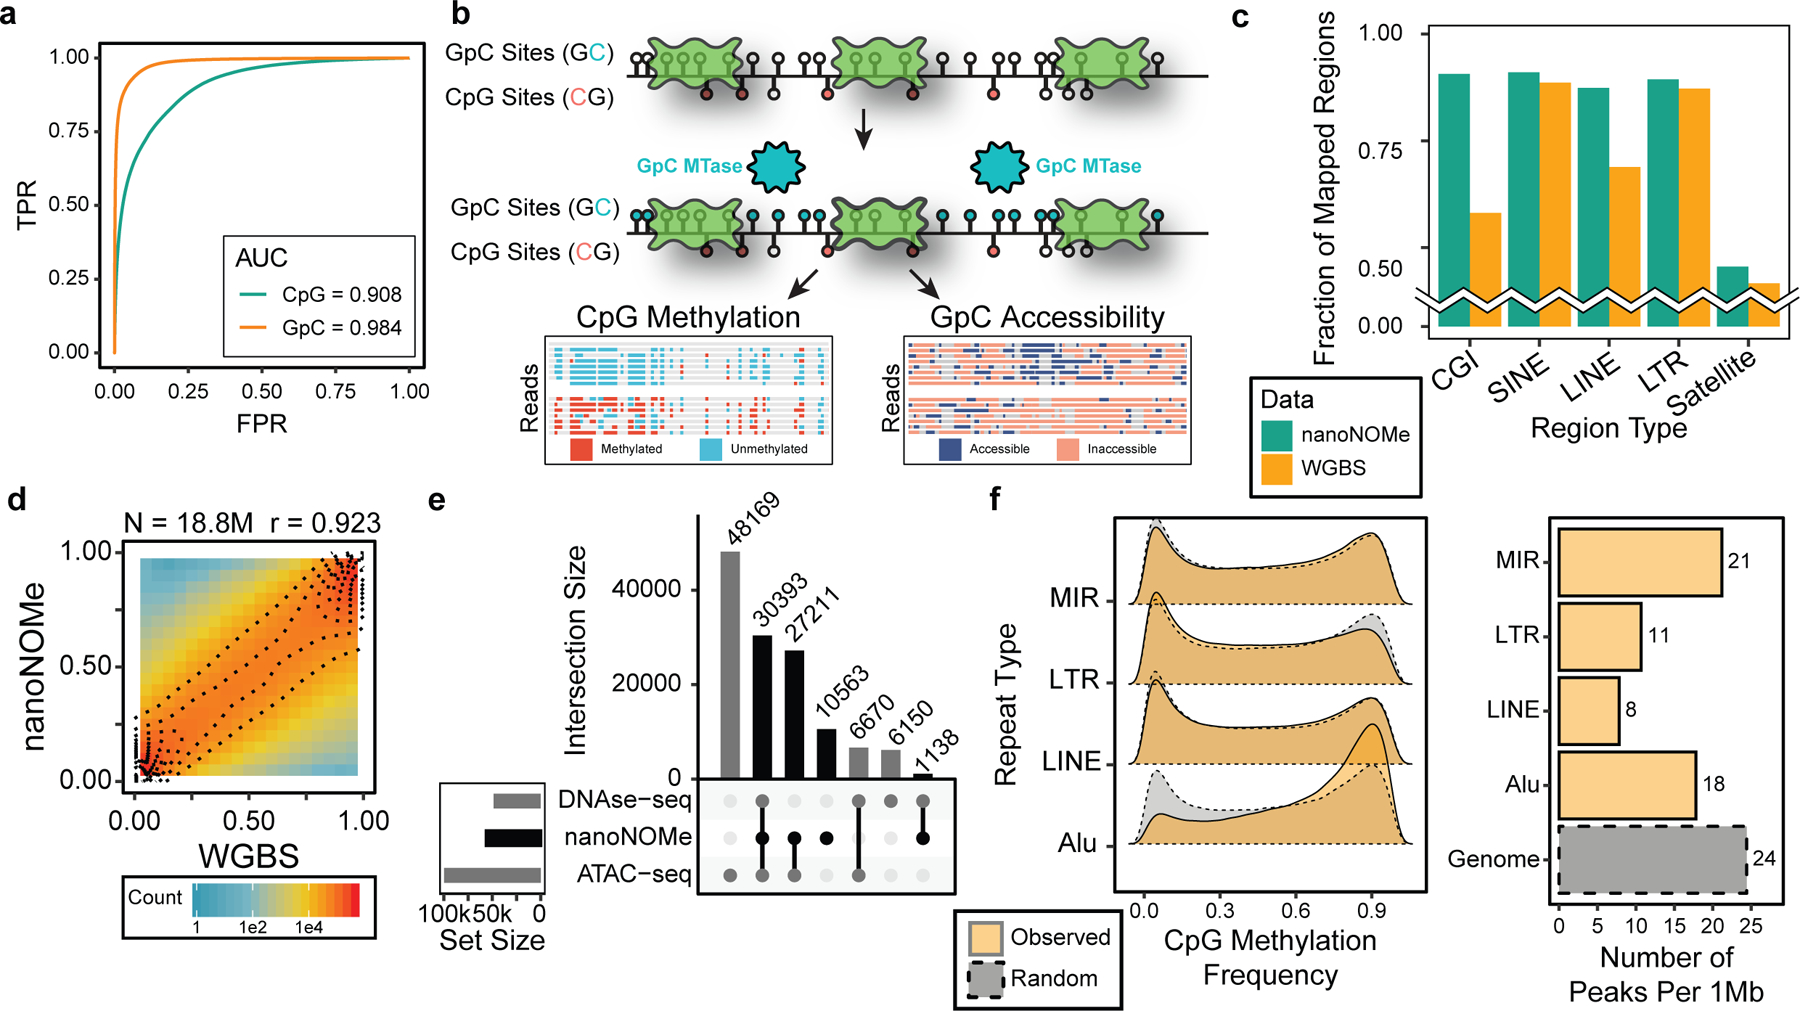
(a) ROC curve of methylation calling for a range of LLR thresholds on control samples (GM12878 genomic DNA modified with CpG and GpC methylation). (b) A schematic of exogenous labeling: intact nuclei are methylated at GpC motifs to serve as the mark for accessibility, and CpG methylation and GpC accessibility can be simultaneously measured. (c) Comparison of fraction of low sequence complexity regions between WGBS and nanoNOMe that had robust read coverage (coverage between 5th and 95th percentile of genome coverage). (d,e) Validation of NanoNOMe profiles by (d) pair-wise comparison of per-CpG average methylation from nanoNOMe with WGBS in across the genome, and (e) intersections of accessibility peaks from nanoNOMe, DNAse-seq, and ATAC-seq. (f) (Left) Distribution of observed per-CpG site methylation frequency in repetitive elements in comparison to random regions across the genome of the same lengths and (right) number of accessibility peaks per 1Mb of repetitive regions in comparison to the entire genome