
Extended Data Fig. 7. Comparison of protein binding prediction with ChIP-seq.
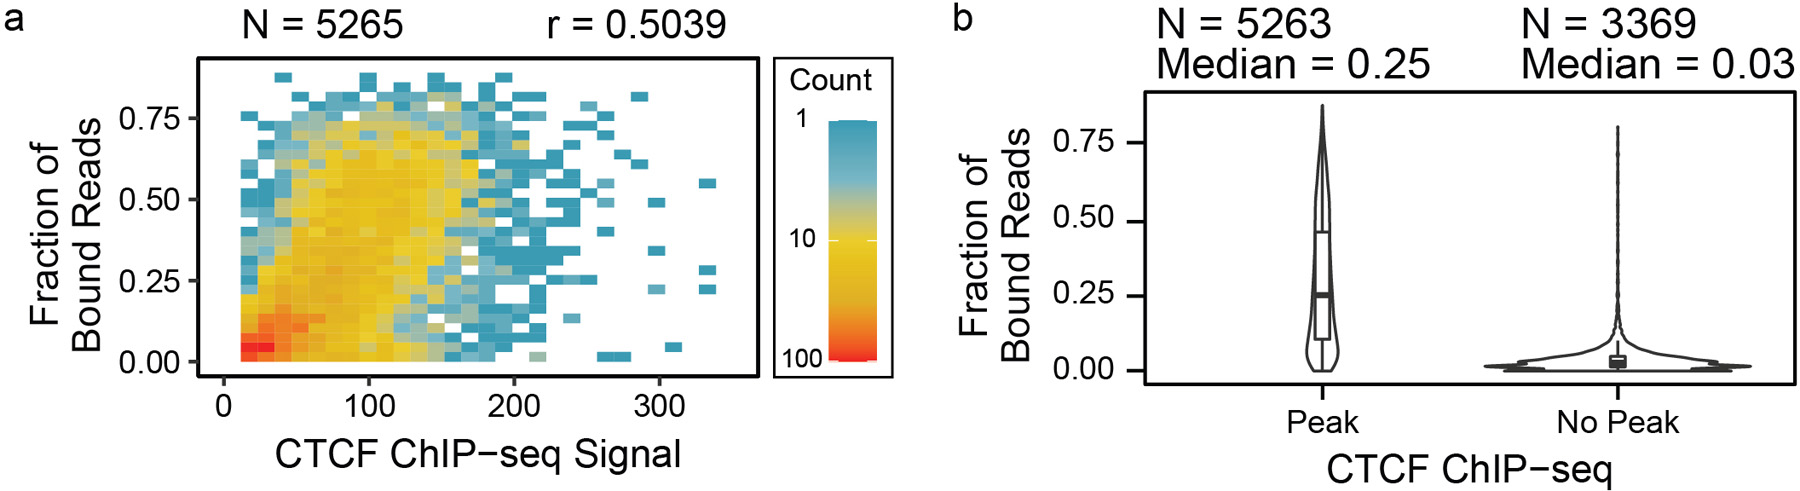
(a) The fractions of CTCF-bound reads determined by sub-nucleosomal footprints were compared with ChIP-seq coverage enrichments per CTCF binding motif, showing that the ChIP-seq signal tends to increase with CTCF binding fraction, and (b) the distributions of the fractions were stratified by binding motifs with ChIP-seq peaks to those without peaks, showing that sites with ChIP-seq peaks have higher fractions of CTCF binding. Data are presented as median values, interquartile range (IQR), and 1.5X IQR, as well as density distributions.