
Extended Data Fig. 9. X-chromosome inactivation promoter comparisons.
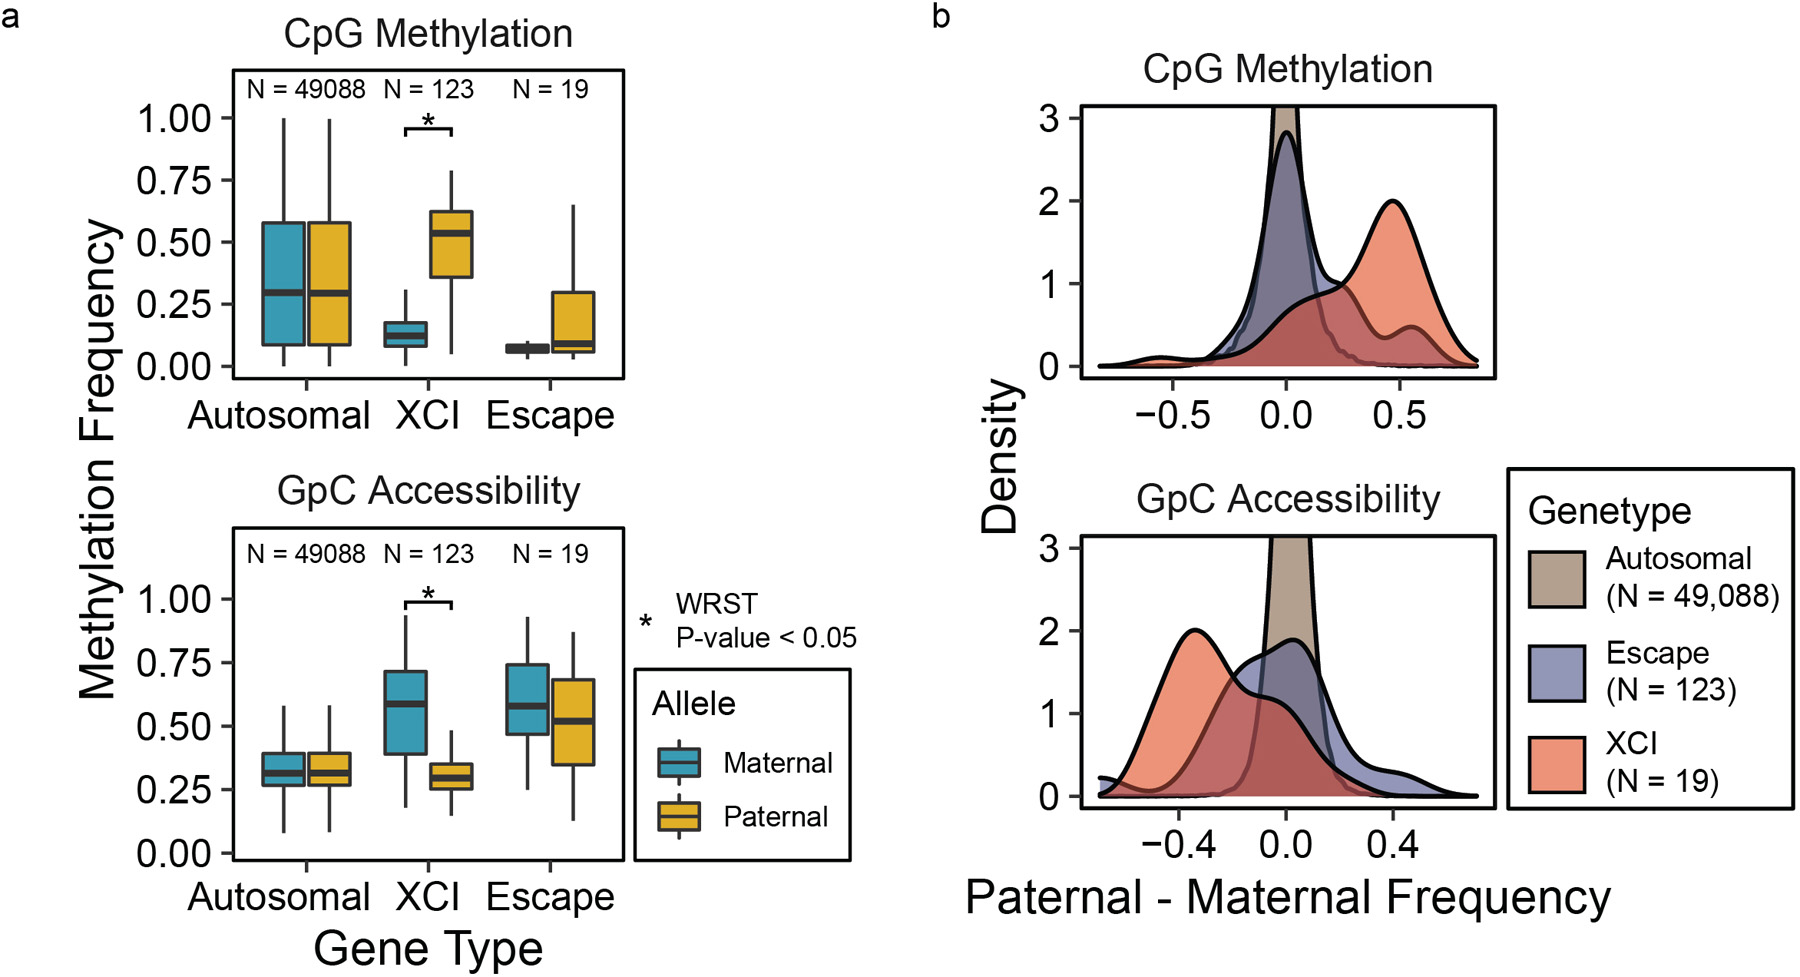
Methylation and accessibility in 500 bp and 100 bp windows, respectively, centered at TSS compared between maternal and paternal alleles (N = number of genes in the group), (a) by plotting and comparing the distributions using boxplots and one-sided Wilcoxon rank-sum test (Data are presented as median values, interquartile range (IQR), and 1.5X IQR, CpG XCI Pat > Mat p-value = 0, GpC XCI Mat > Pat p-value = 1.9e-229 ), and (b) by density plots of the difference in methylation frequencies between the two alleles.