
Extended Data Fig. 10. Differentially methylated and differentially accessible regions between alleles in GM12878.
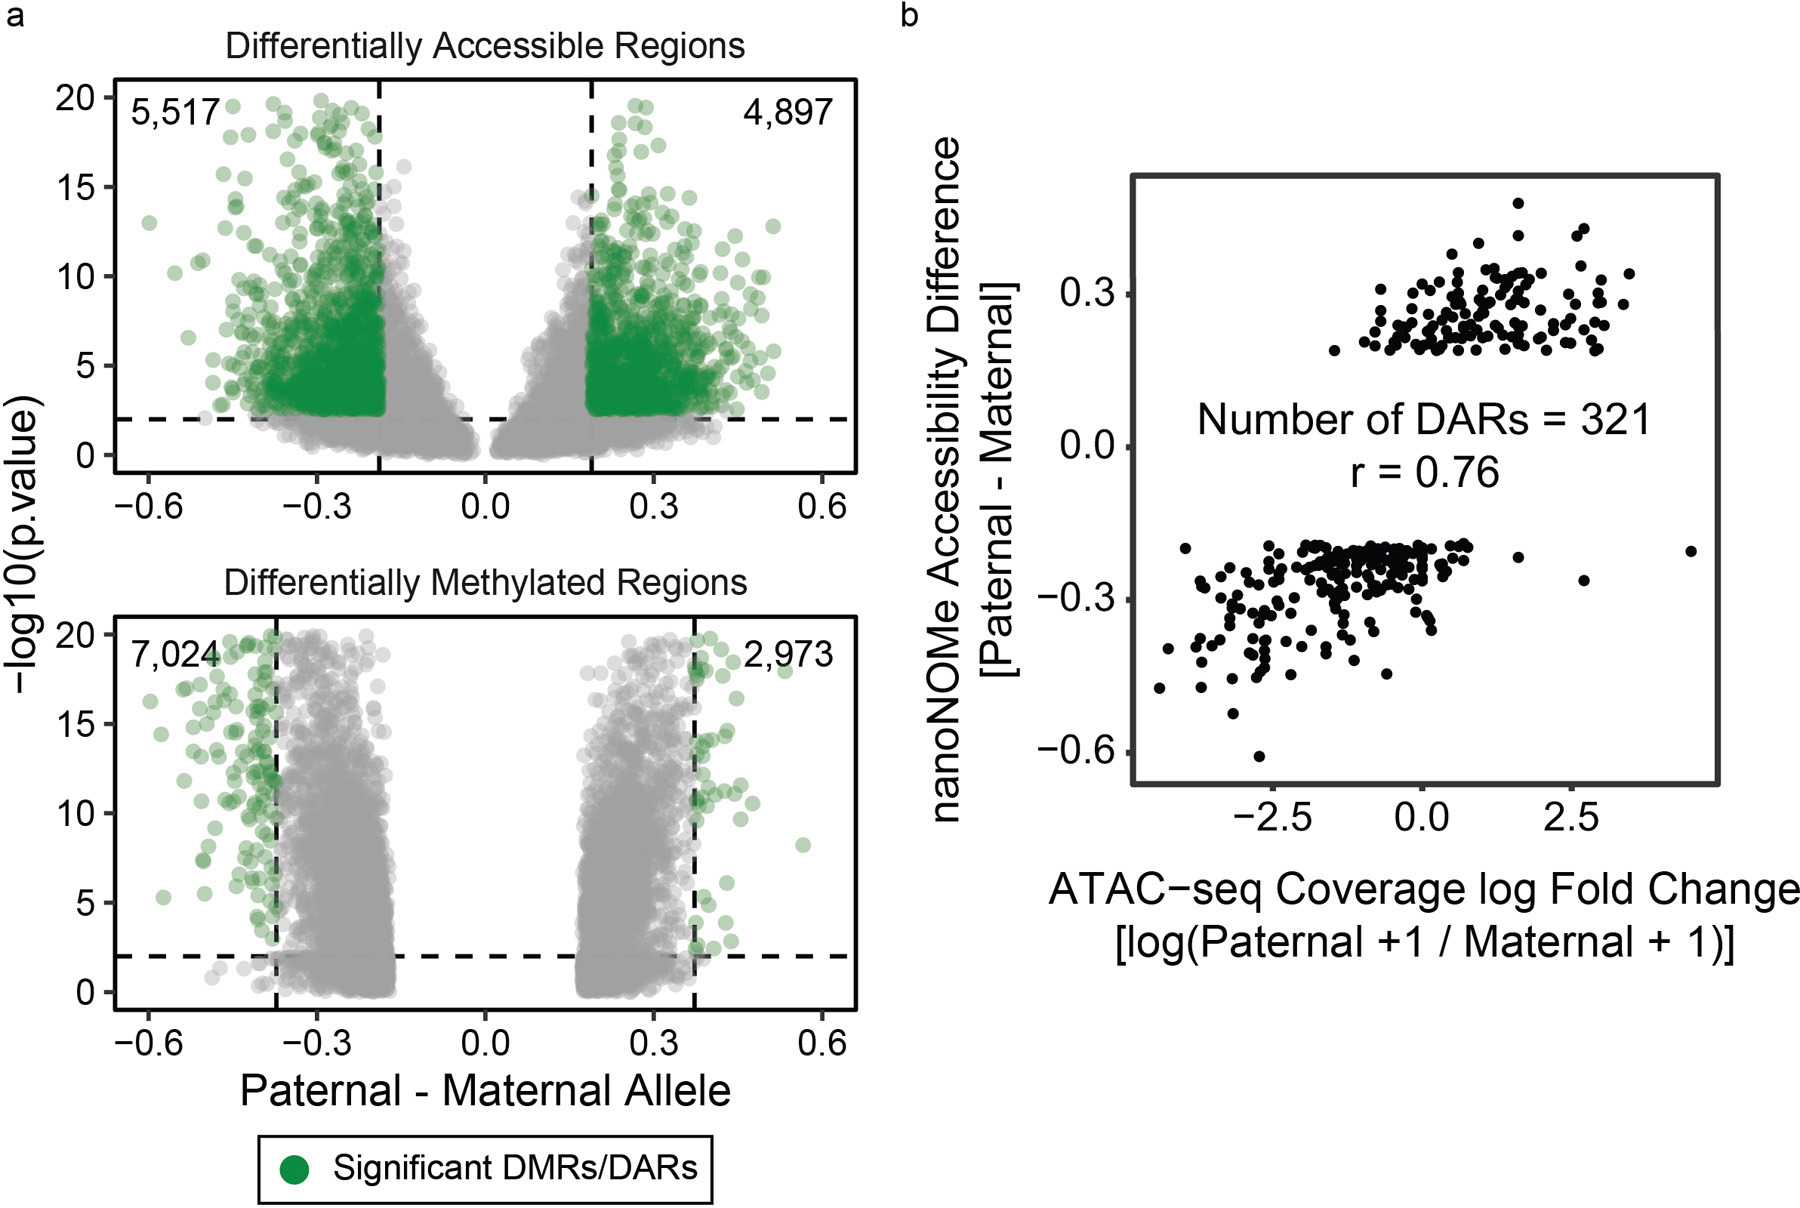
Methylation was compared between the two alleles across the genome to find regions of significant difference and were tested using one-sided Fisher’s exact test, and accessibility peaks were compared by 1) finding peaks of accessibility on each allele separately, 2) selecting peaks that occur exclusively in one allele, 3) and comparing the accessibility frequency between the two alleles in these candidate regions. The detected DMRs and DARs are (a) shown as volcano plots, with dashed lines representing thresholds for considering the region as DMR/DAR. (b) Examining existing (GEO Accession GSM1155957) ATAC-seq data, we compared allele specific accessible in ATAC-seq peaks that overlapped with a heterozygous SNP. In the 321 DARs detectable via ATAC-seq, we saw high correlation with nanoNOMe (r=0.76).