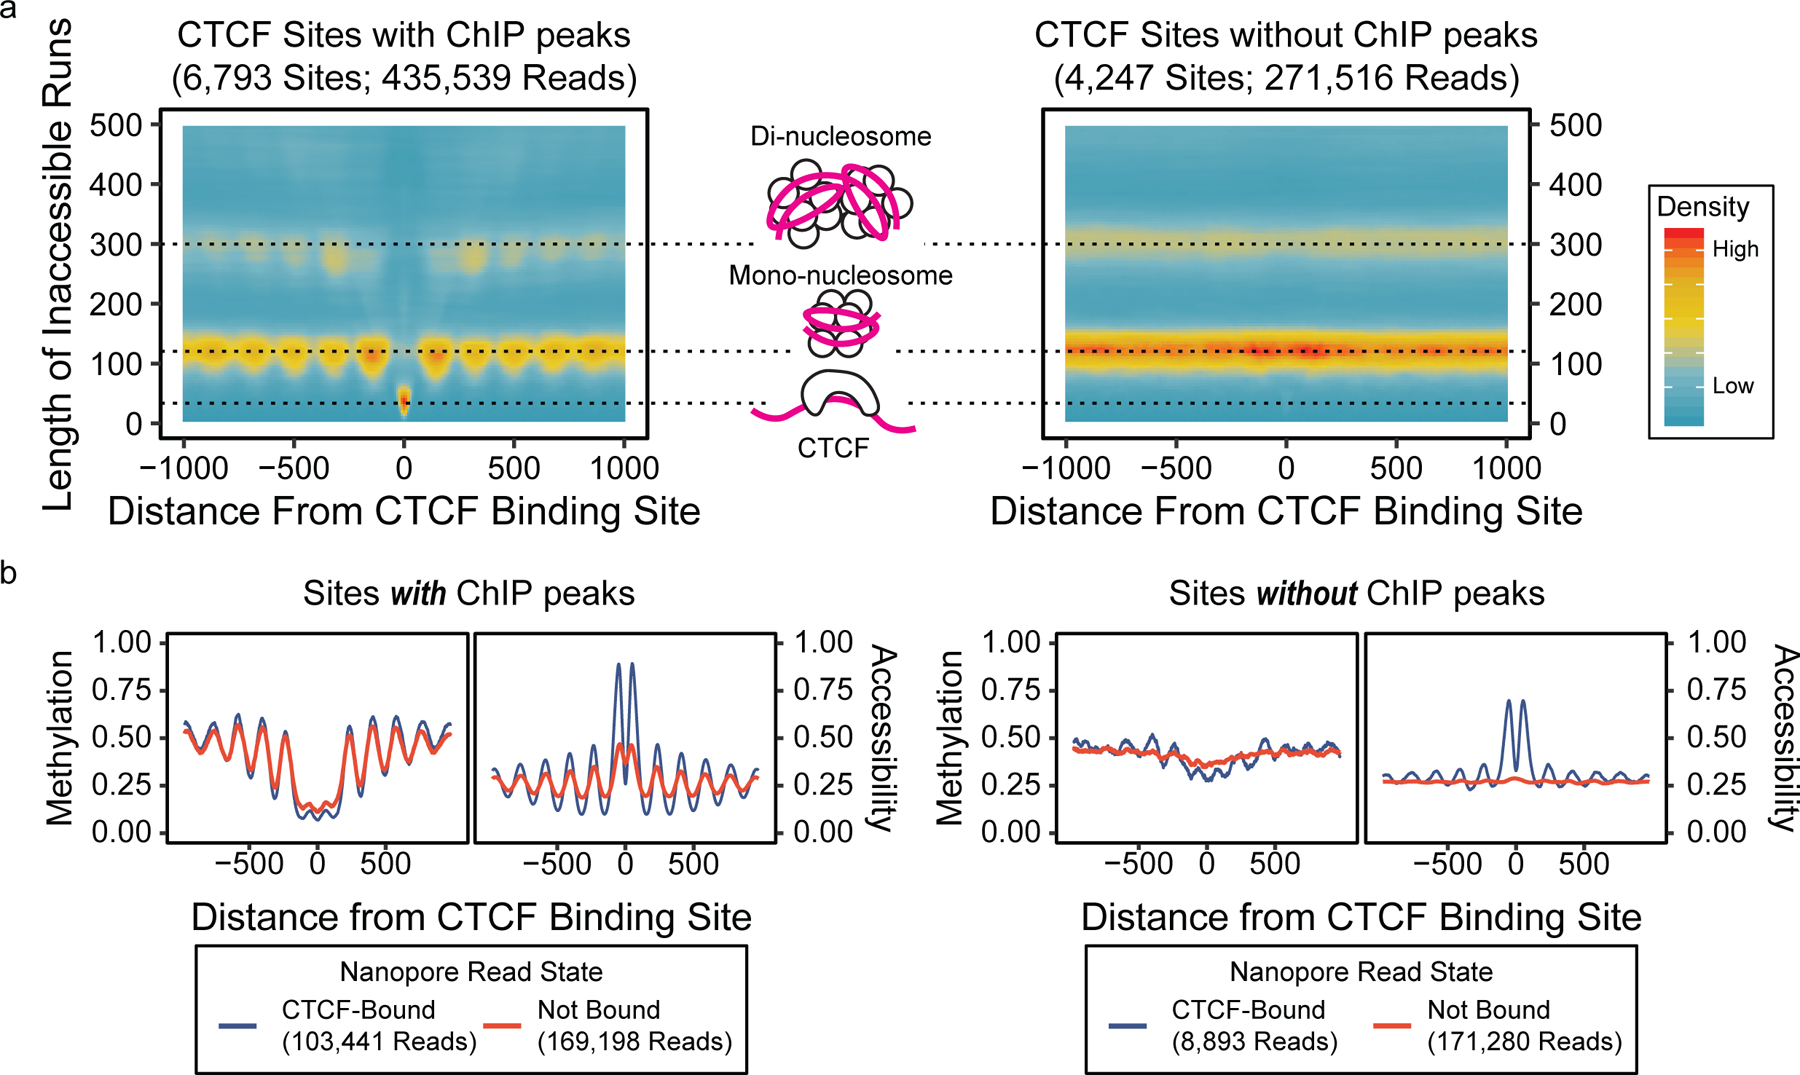
Figure 2. DNA accessibility assessment on transcription start sites and CTCF binding sites using individual reads.

(a) Heatmaps of lengths of inaccessible runs on individual reads versus distance from CTCF binding sites, showing the relationship between inaccessible run lengths and protein or nucleosome footprints. (b) Metaplots at CTCF binding sites, separated by the presence of CTCF ChIP-seq peaks by panel and read-level CTCF binding by color.
