
Figure 3. Single-read epigenetic analysis on gene promoters.
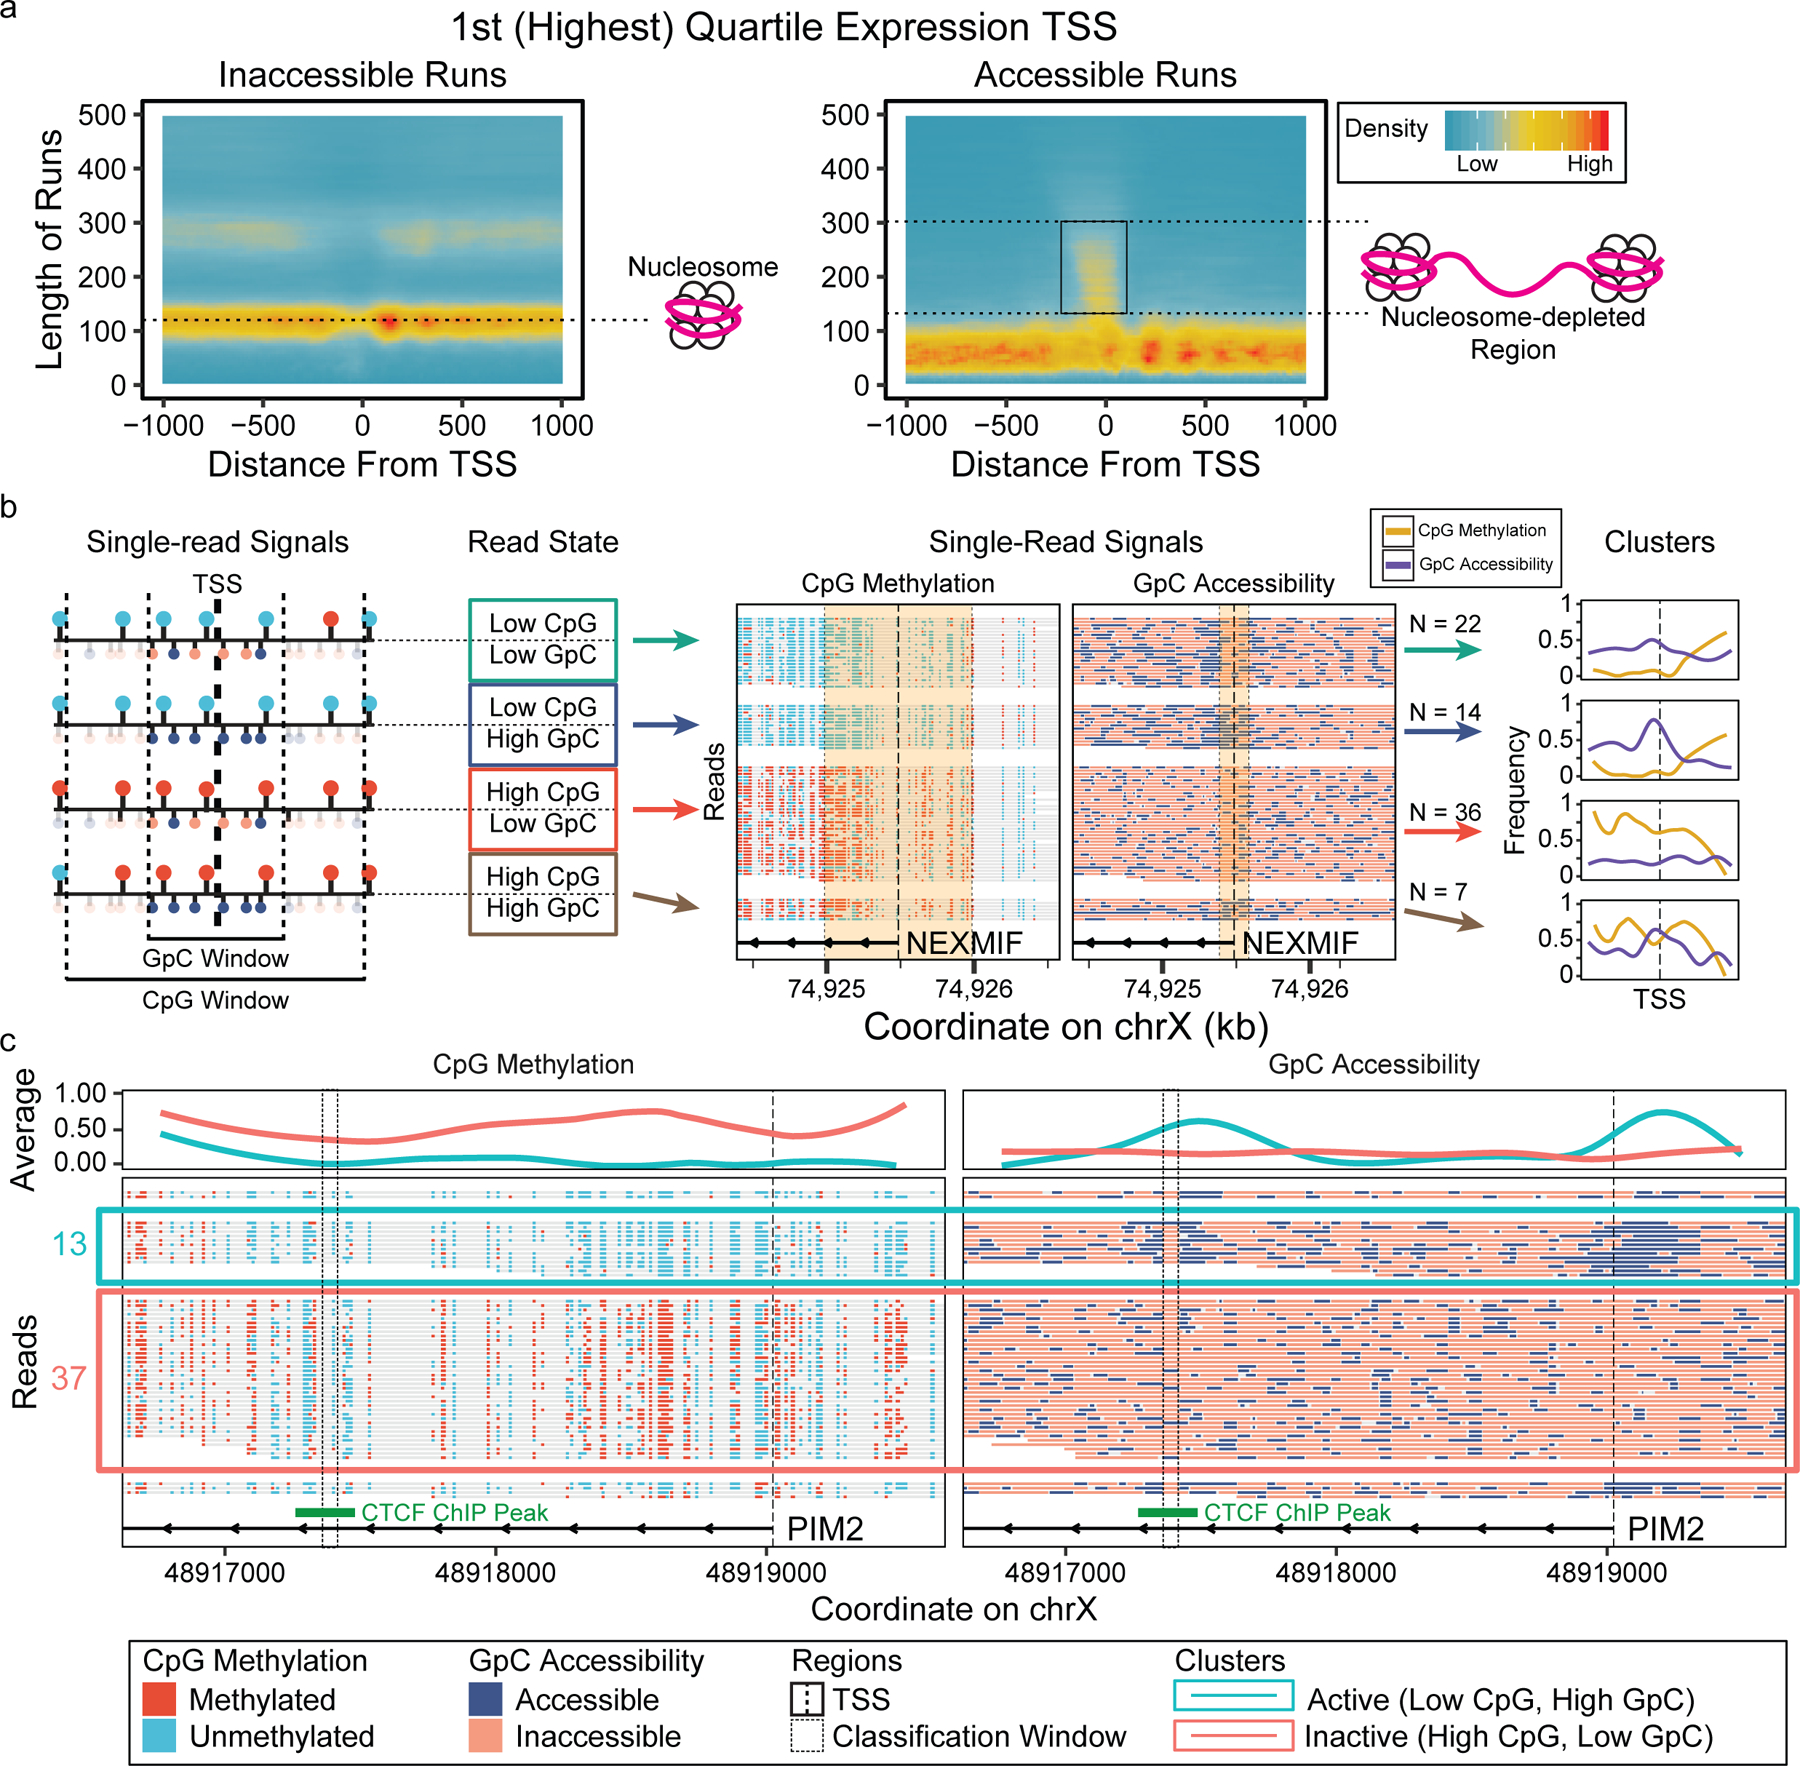
(a) Heatmaps of lengths of inaccessible and accessible runs on individual reads versus distance from transcription start sites of highly expressed genes, showing nucleosome positioning and nucleosome depleted regions. (b) Reads on TSS can be classified based on the combinatorial epigenetic signatures near TSS and clustered based on these classifications. (c) Read-level plots of methylation and accessibility on TSS of PIM2, showing TF(CTCF) binding 1.5kb downstream of the gene only in concordantly active reads.