
Figure 5. Comparative epigenomic analysis of breast cancer model.
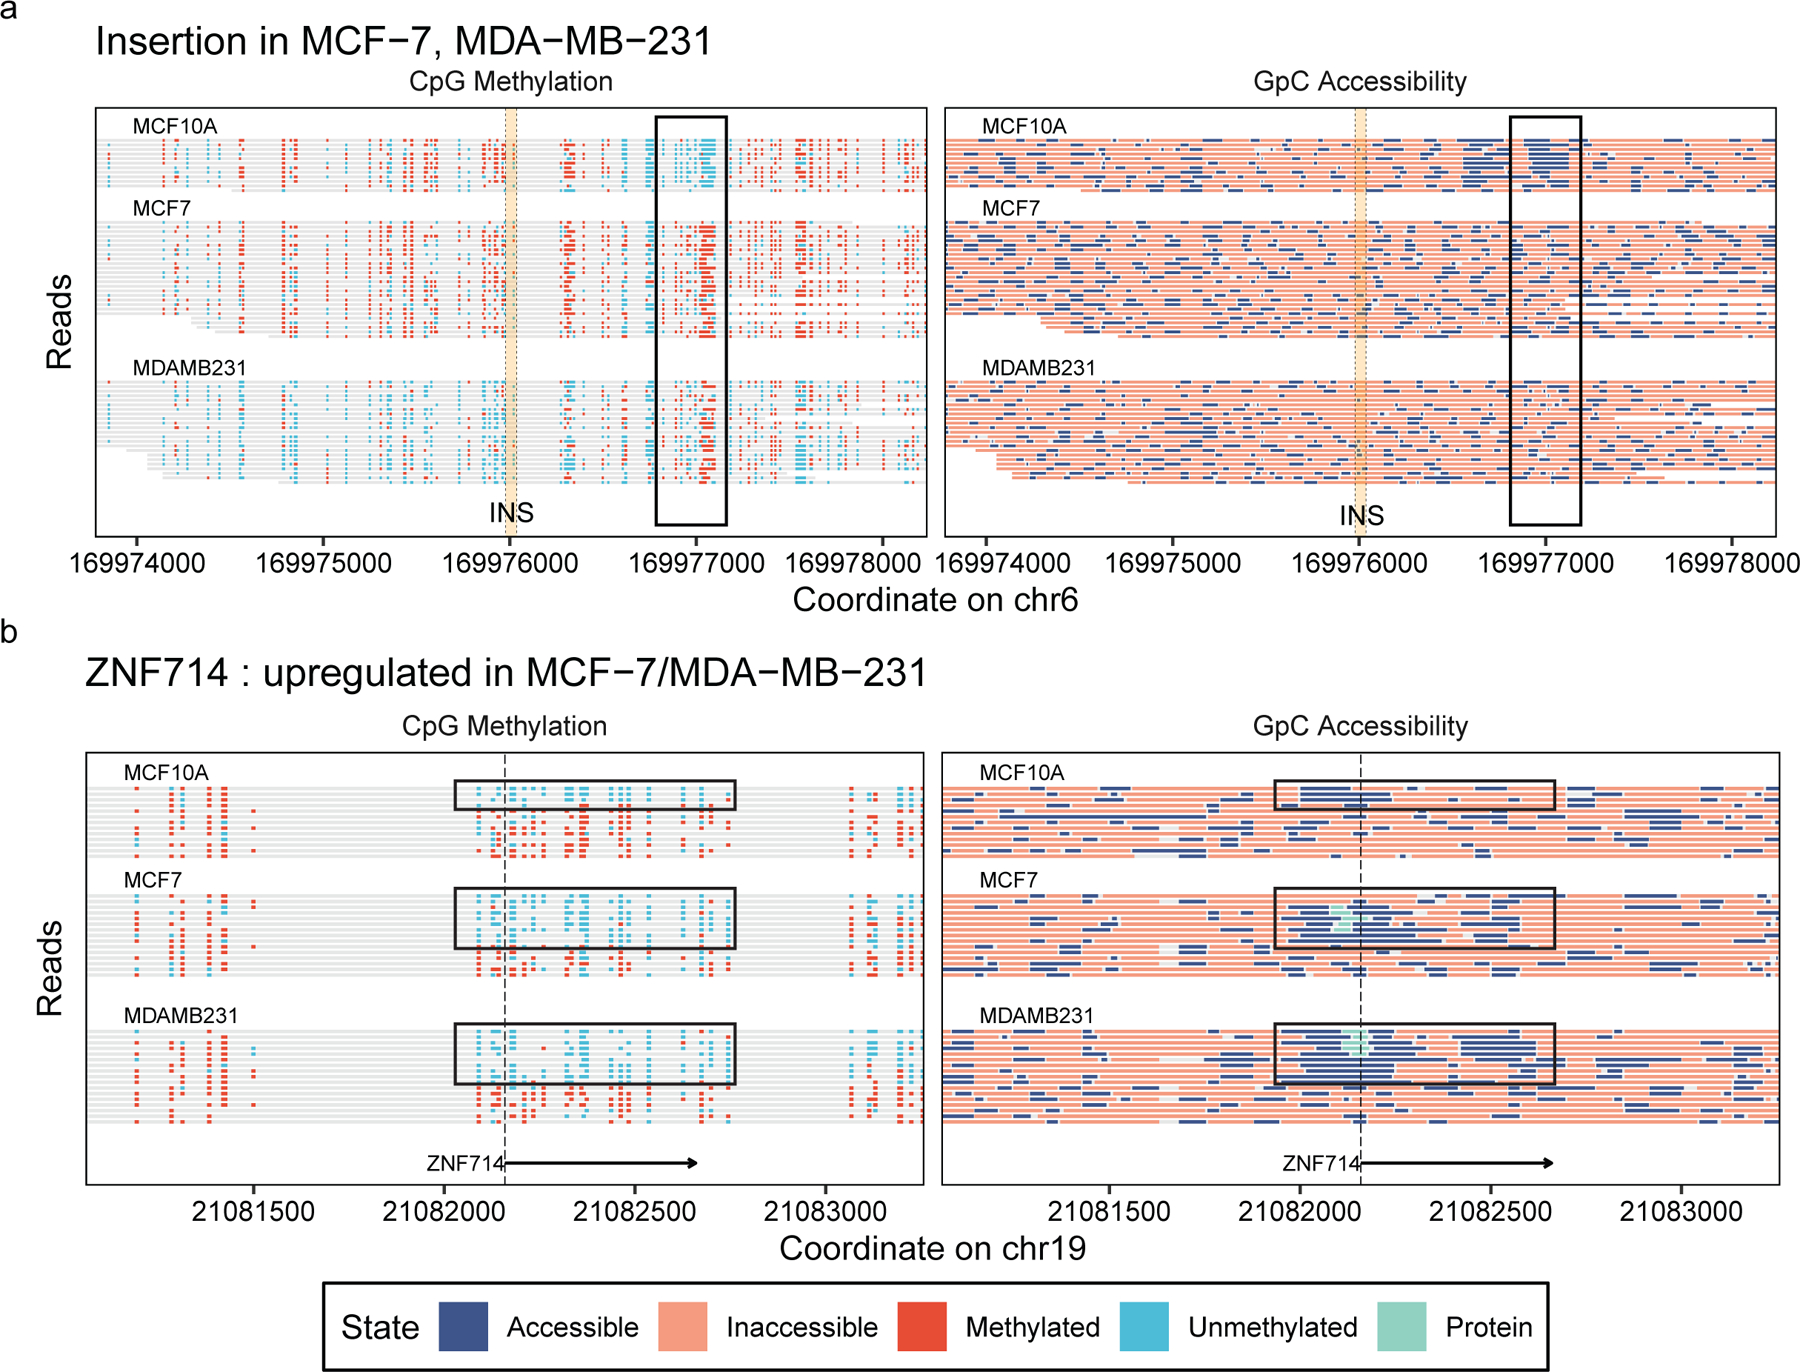
Read-level methylation and accessibility plots (a) near an insertion that is present in MCF-7 and MDA-MB-231 but not in MCF-10A, showing changes in methylation and accessibility downstream of the insertion, and (b) on the TSS of ZNF714 gene, which is upregulated in MCF-7 and MDA-MB-231 in comparison to MCF-10A, showing the differences in the estimated protein binding and combinatorial epigenetic signatures.