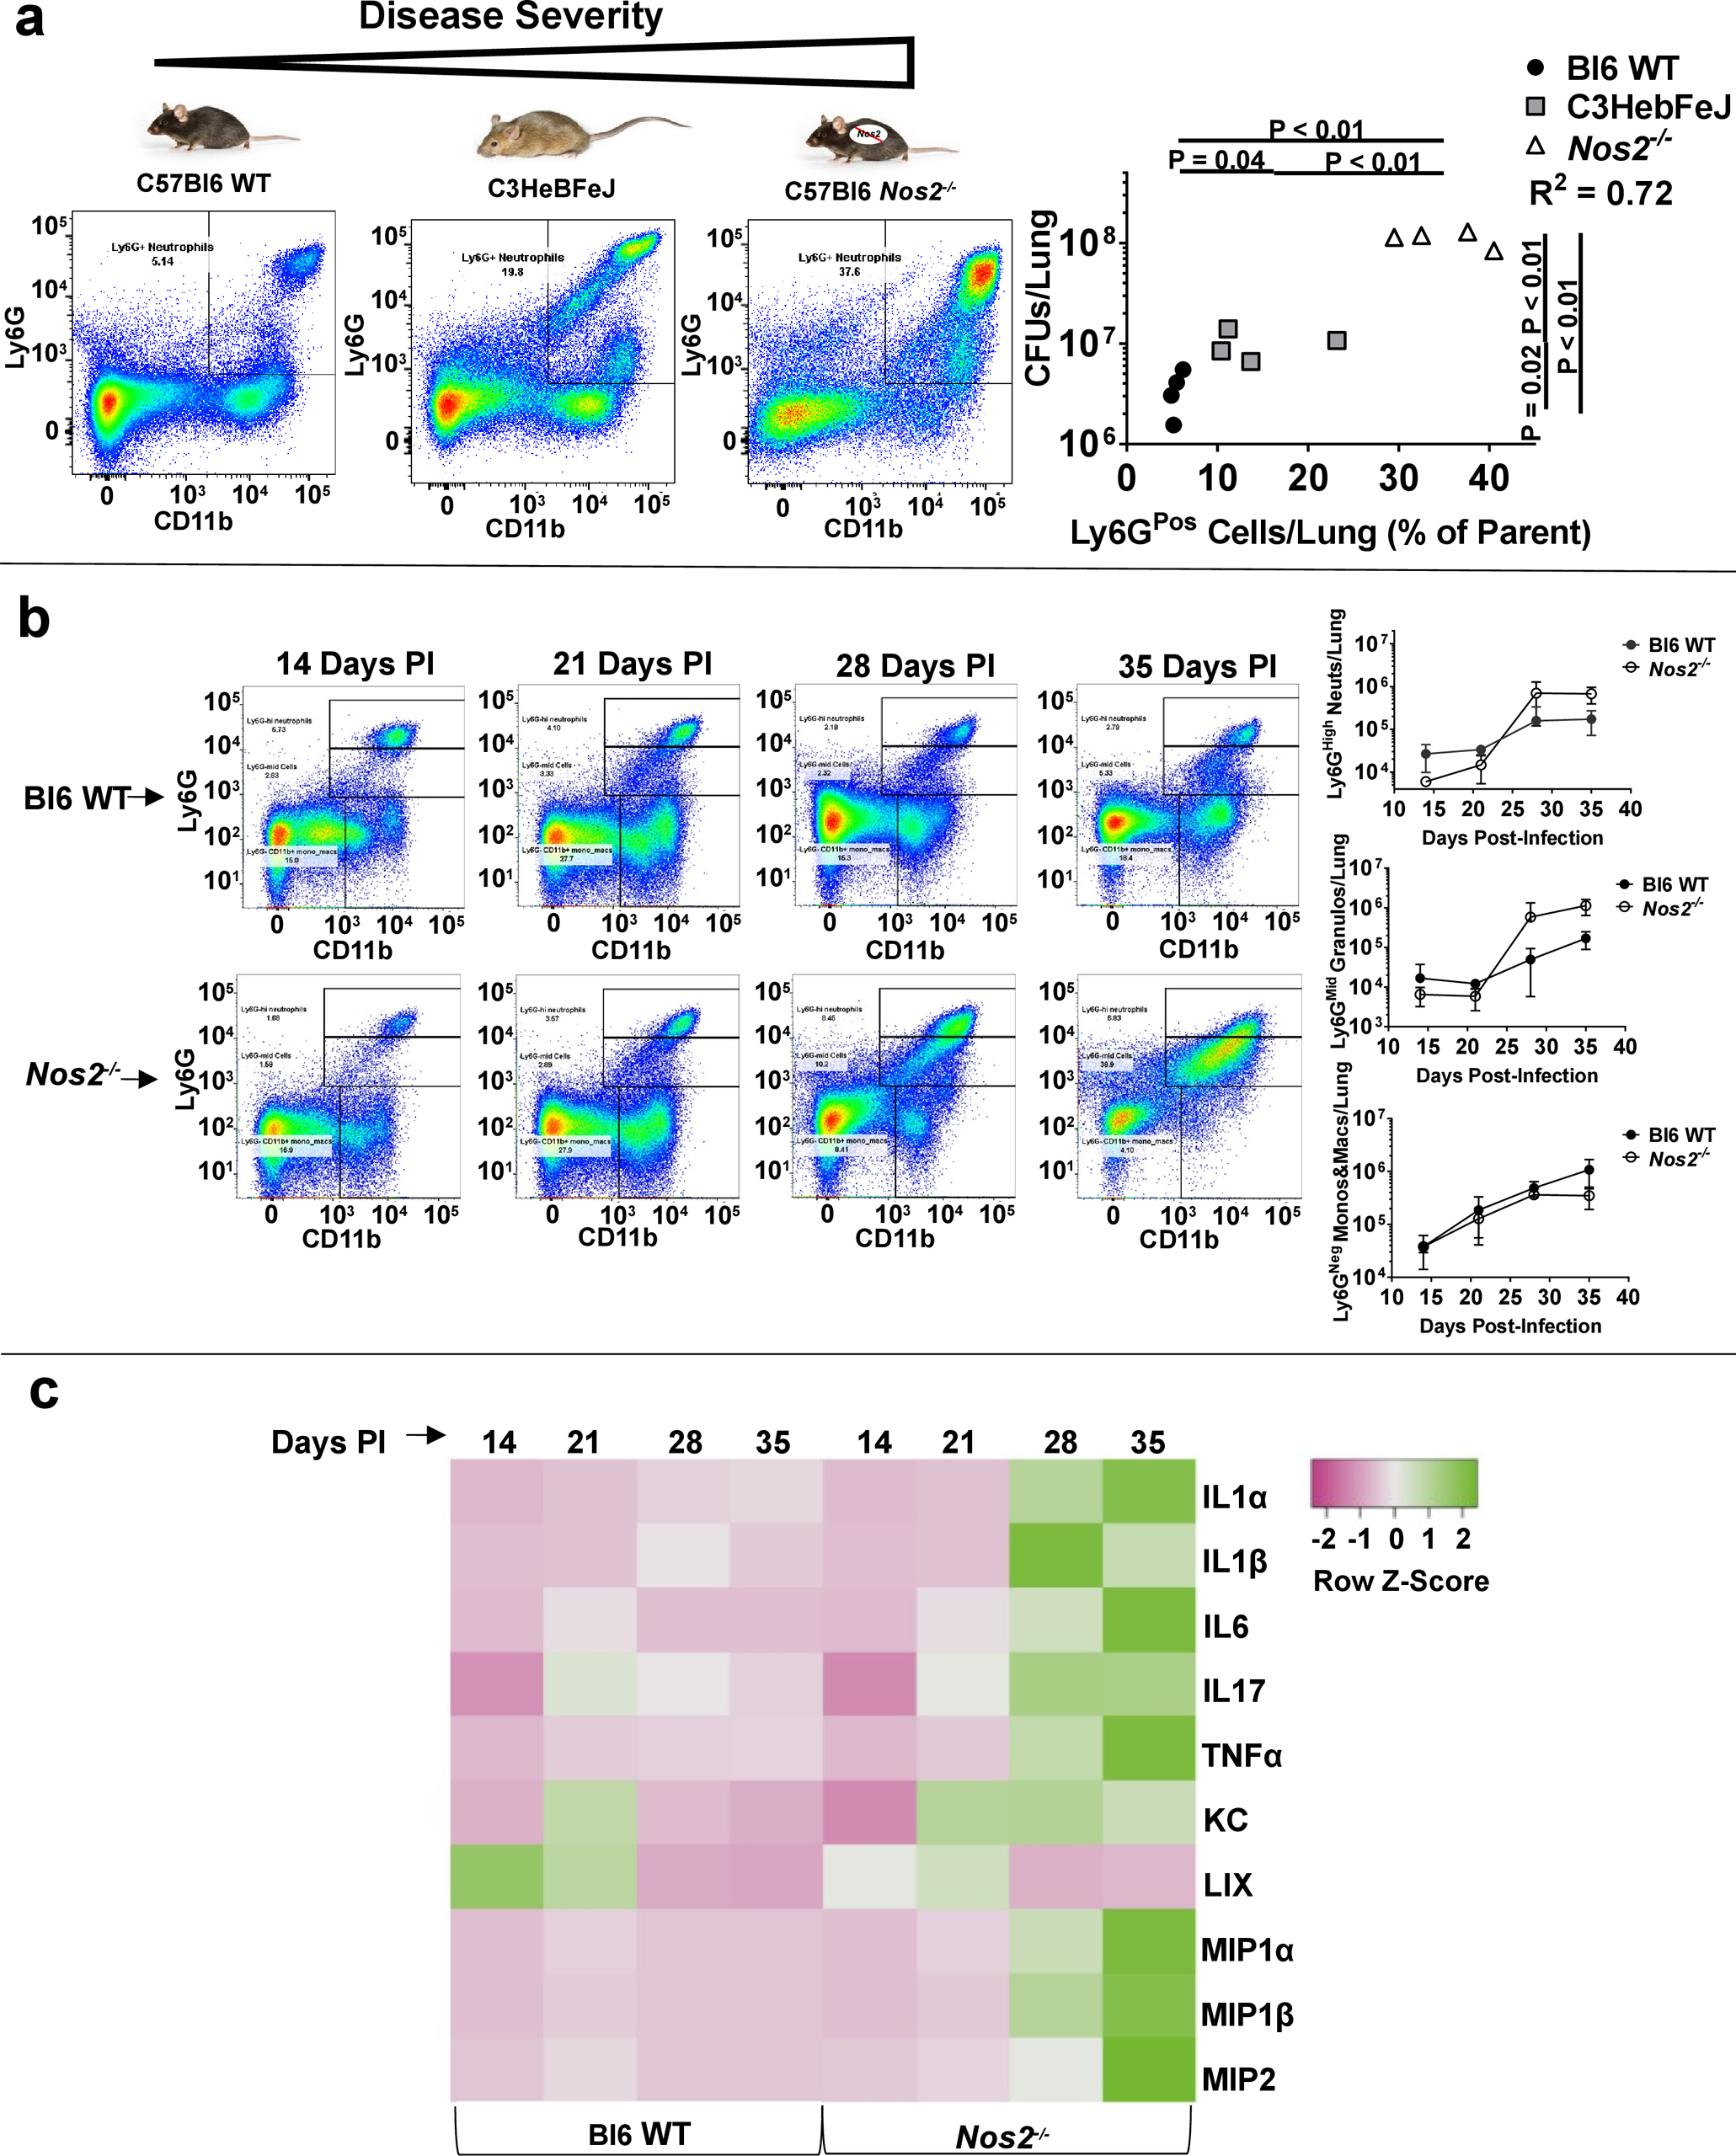
Figure 1. Influx of Ly6GPos cells into the pulmonary compartment correlates with Mtb burden, inflammatory cytokines, and disease severity.

a Mouse models of increasingly severe disease (left to right), with representative scatterplots of CD11bHigh Ly6GPos pulmonary cells at 28 days PI, and quantified (far right) as percent Ly6Gpos cells by recovered CFUs in the lung of each individual mouse. b Representative scatterplots (left) and quantification (right) of CD11bHigh Ly6GHigh neutrophils (top right), CD11bHigh Ly6GMid granulocytes (middle right), and CD11bHigh Ly6GNeg monocytes/macrophages (bottom right) in Bl6 WT or Nos2−/− mice at the indicated time points PI. N = 4 mice per group and error bars represent standard deviation between biological replicates within each group. c Multiplex analysis of the indicated cytokines and chemokines in the lungs of Bl6 WT or Nos2−/− mice at the indicated time points PI. Heatmap represents the average pg/mL of detected cytokine/chemokine from 4 mice per group scaled by row.
