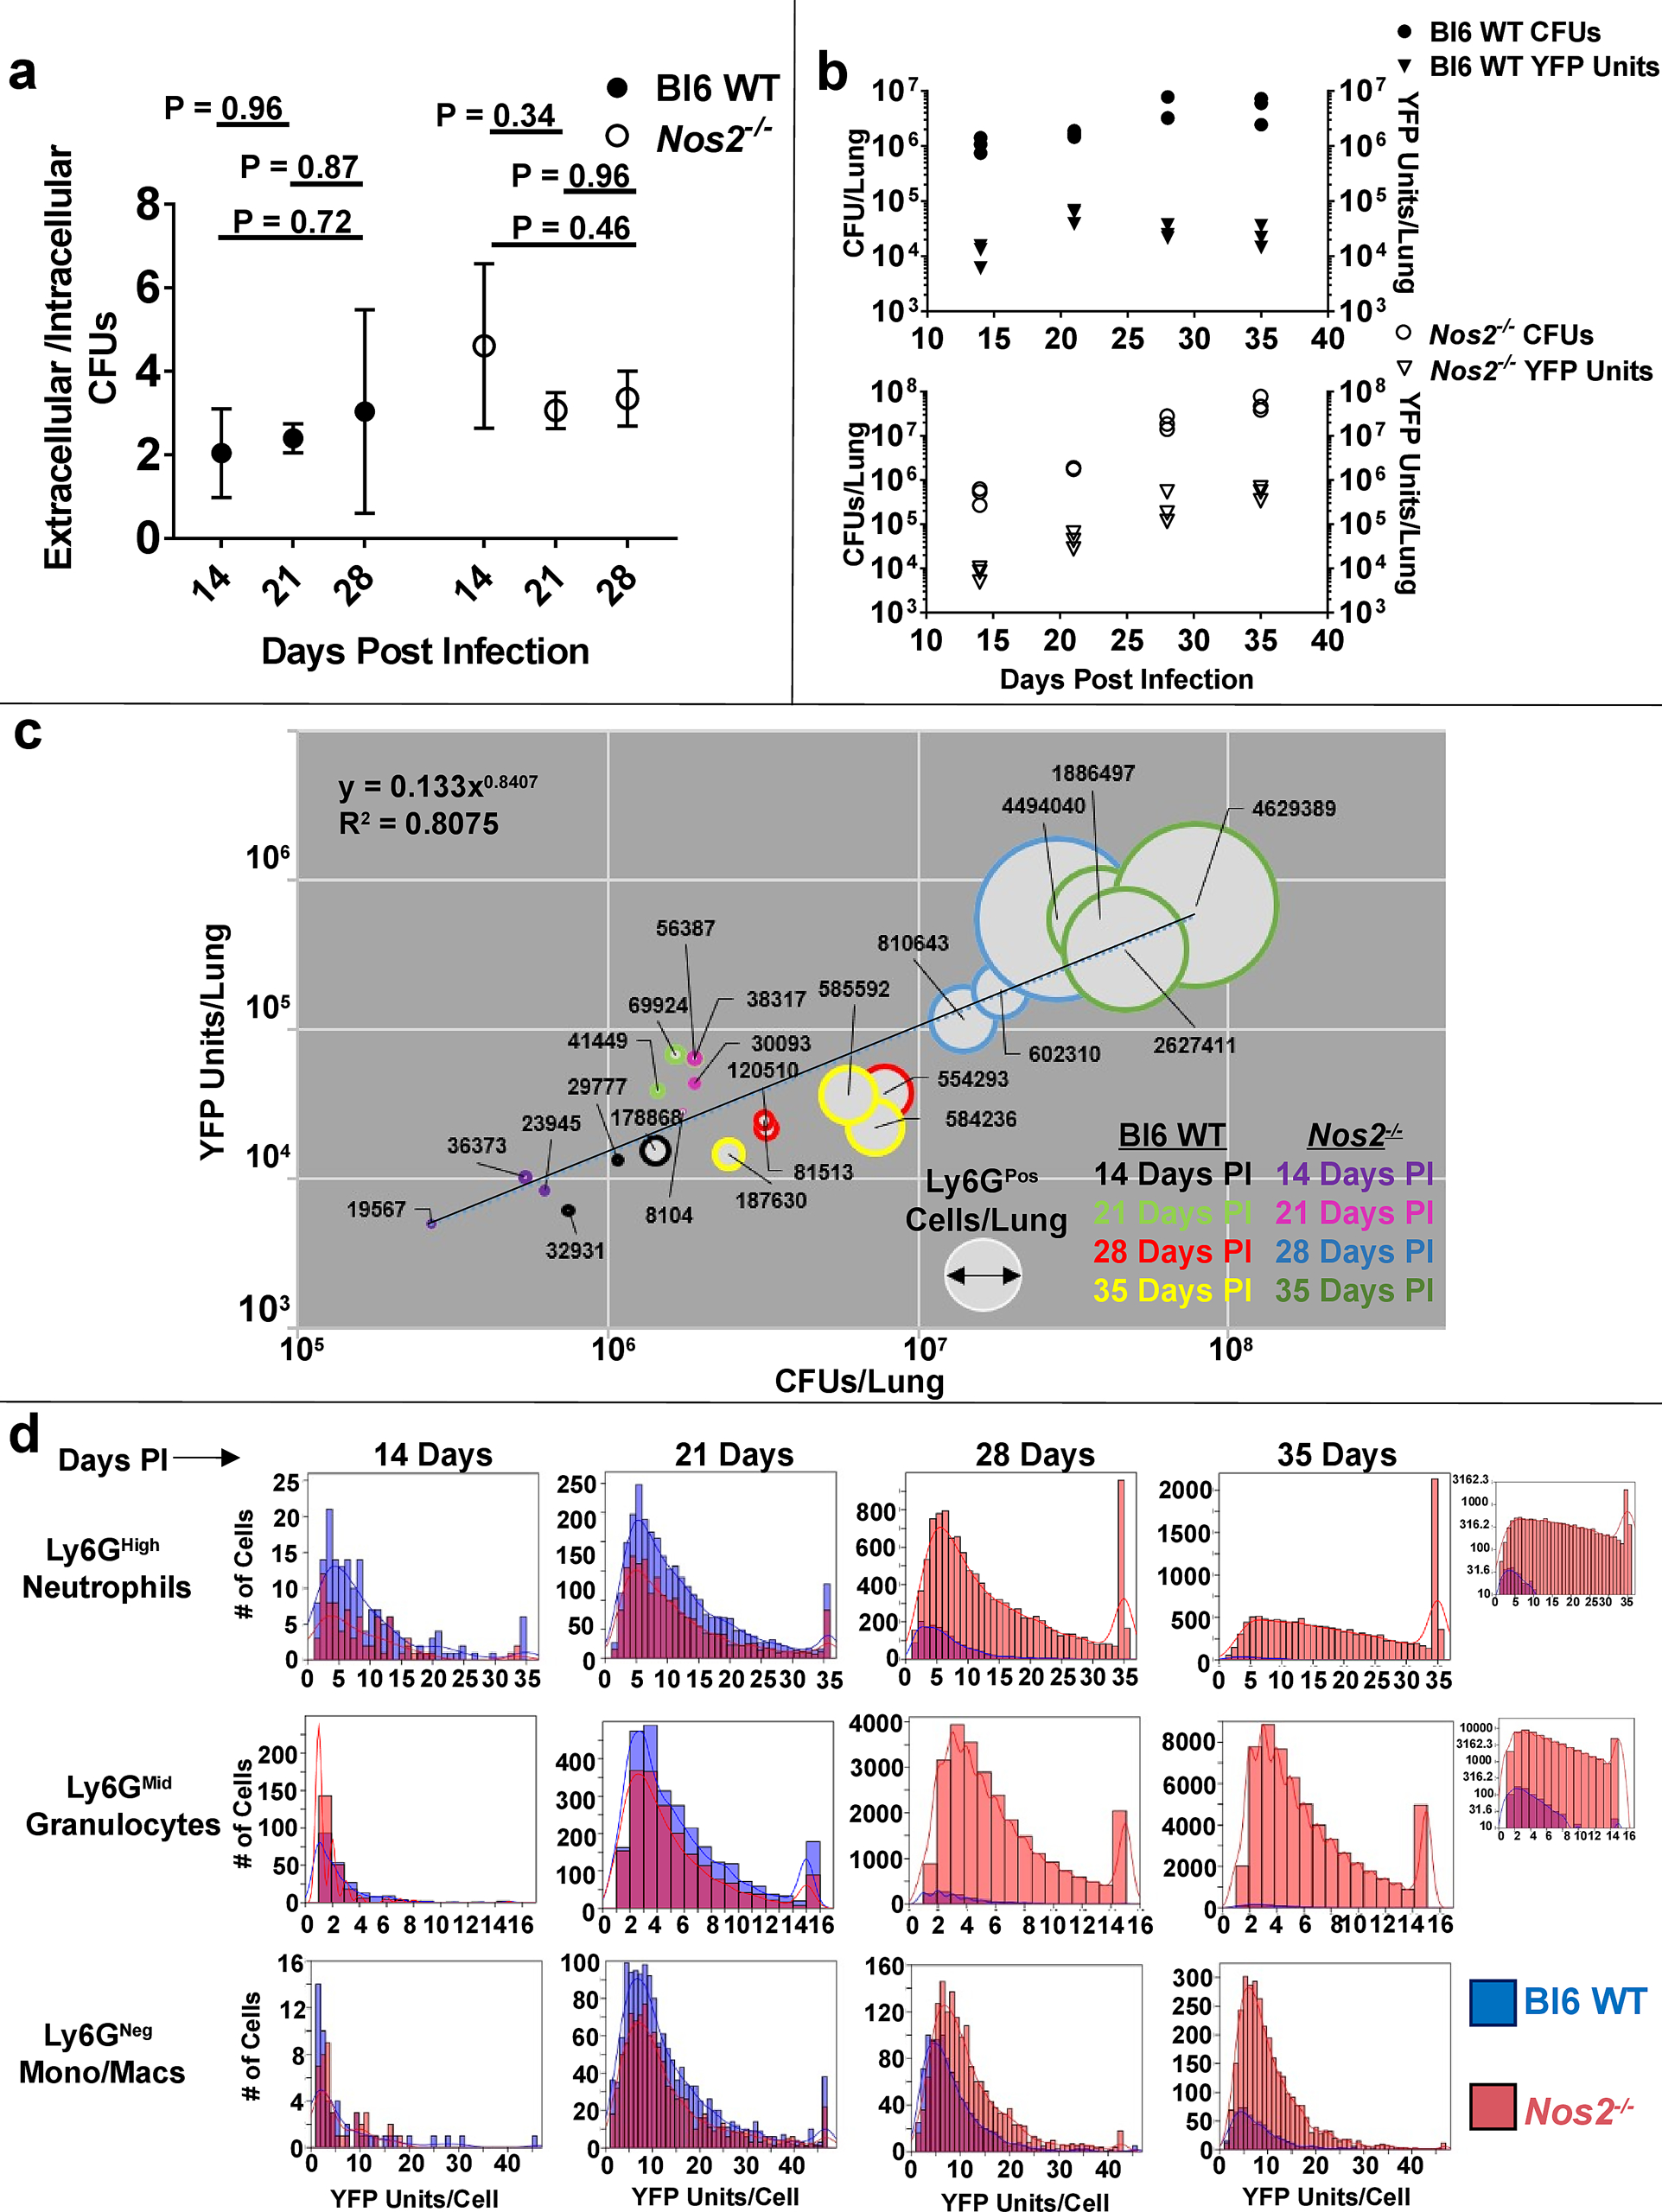
Figure 4. Mtb preferentially associates with Ly6GPos cells during loss of immune containment.

a Ratio of extracellular/intracellular CFUs recovered from the lungs of msfYFP-Mtb infected Bl6 WT or Nos2−/− mice at the indicated time points. Error bars represent standard deviation between mice within each group. Statistical values based on one-way ANOVA with Tukey’s Multiple Comparison analysis. b CFUs (circles, left Y-axis) or normalized YFP Units (triangles, right Y-axis) in the lungs of msfYFP-Mtb infected Bl6 WT (top) or Nos2−/− (bottom) mice at the indicated time points. Each data point represents 1 mouse. c YFP units (Y-Axis) as a function of CFUs (X-axis) and Ly6GPos cell number (width of circles with numerical label) in the lungs of infected Bl6 WT or Nos2−/− mice. Time points are indicated by coloring. “R2” indicates the correlation coefficient for the fitted line. d Number of YFP Units per cell in msfYFP-Mtb associated CD11bHigh Ly6GHigh, CD11bHigh Ly6GMid, or CD11bHigh Ly6GNeg cells from Bl6 WT (blue bars) or Nos2−/− (pink bars) mice at the indicated timepoints. Inset: YFP Units per cell within Ly6GHigh or Ly6GMid compartments at 35 days PI, graphed on a log Y-axis for ease of visualization. N = 3 mice per group per time point, or 3 mice per group per bar graph.
