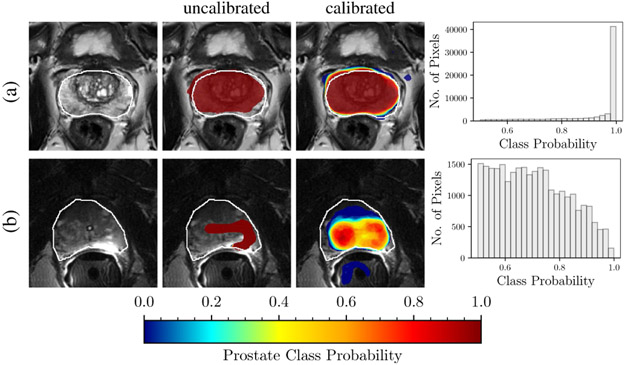
Fig. 1. Calibration and out-of-distribution detection.
Models for prostate gland segmentation were trained with T2-weighted MR images acquired using phased-array coils. The results of inference are shown for two test examples imaged with: (a) phased-array coil (in-distribution example), and (b) endorectal coil (out-of-distribution example). The first column shows T2-weighted MRI images with the prostate gland boundary drawn by an expert (white line). The second column shows the MRI overlaid with uncalibrated segmentation predictions of an FCN trained with Dice loss. The third column shows the calibrated segmentation predictions of an ensemble of FCNs trained with Dice loss. The fourth column shows the histogram of the calibrated class probabilities over the predicted prostate segment of the whole volume. Note that the bottom row has a much wider distribution compared to the top row, indicating that this is an out of distribution example. In the middle column, prediction prostate class probabilities ≤ 0.001 has been masked out.

