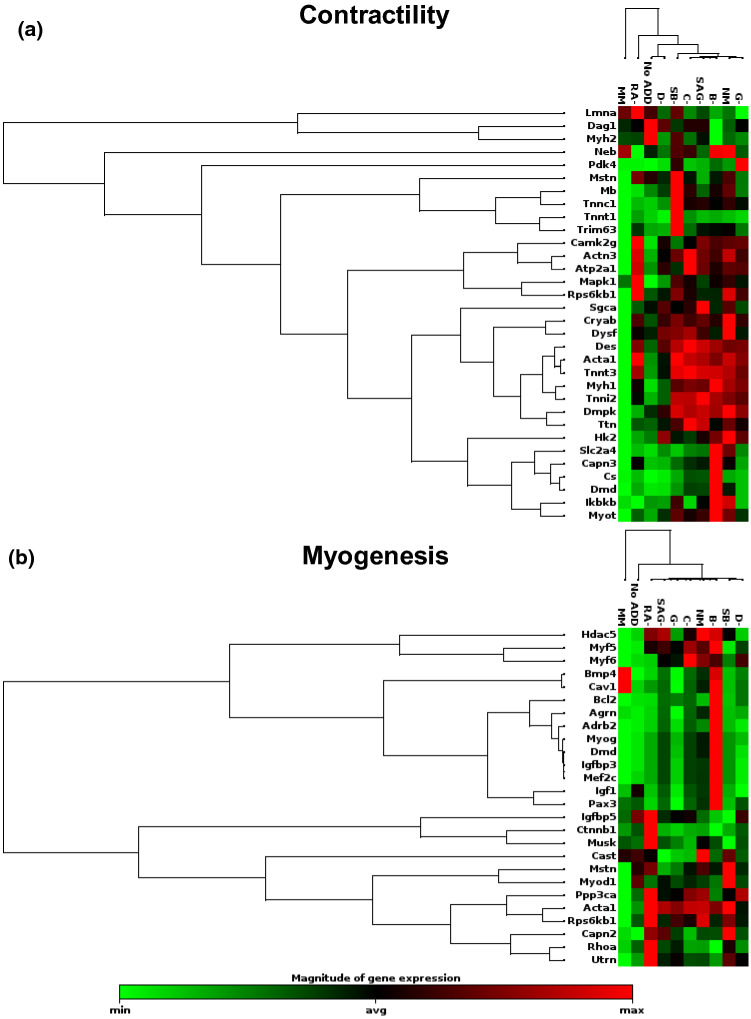
Figure 4.
Unsupervised hierarchical clustering of genes associated with contractility and myogenesis for day 4 C2C12 cells cultured on GEL-LN patterned with 20 µm × 10 µm grooves and ridges. Genes are listed to the left for (a) contractility and (b) Myogenesis. Media conditions are represented on the top of each cluster. Green represents downregulation, black is the average gene expression, and red represents upregulation of a gene.

