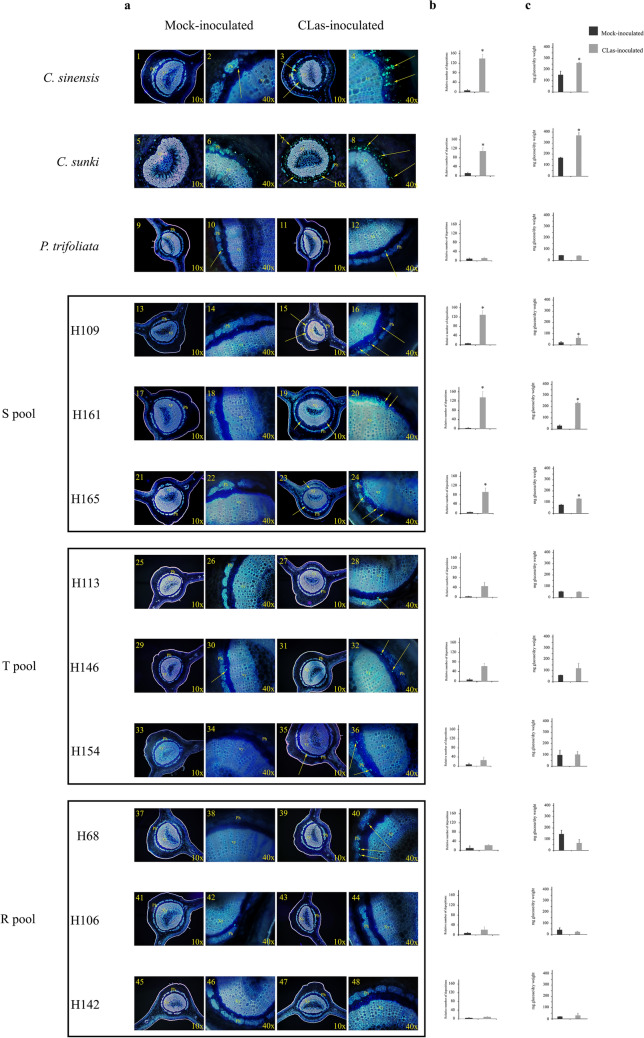
Figure 1.
Callose deposition. (a) Cross sections of leaf petioles of C. sinensis mock-inoculated (1 and 2) and CLas inoculated (3 and 4), C. sunki mock-inoculated (5 and 6) and CLas inoculated (7 and 8), P. trifoliata mock-inoculated (9 and 10) and CLas inoculated (11 and 12), H109 mock inoculated (13 and 14) and CLas inoculated (15 and 16), H161 mock-inoculated (17 and 18) and CLas inoculated (19 and 20), H165 mock-inoculated (21 and 22) and CLas inoculated (23 and 24), H113 mock-inoculated (25 and 26) and CLas inoculated (27 and 28), H146 mock-inoculated (28 and 30) and CLas inoculated (31 and 32), H154 mock-inoculated (33 and 34) and CLas inoculated (35 and 36), H68 mock-inoculated (37 and 38) and CLas inoculated (39 and 40), H106 mock-inoculated (41 and 42) and CLas inoculated (42 and 44), H142 mock-inoculated (45 and 46) and CLas-inoculated (47 and 48). FL, phloem; Xi, xylem. (b) The bar graph next to the microscopy plates show the callose quantification performed by counting fluorescent spots marked by aniline blue dye. Quantification was performed with tree replicates per genotype, inoculated plants (positive or negative HLB) and mock-inoculated plants. (c) Starch quantification. Individuals were inoculated with CLas (CLas-infected) or mock-inoculated (CLas-free) and collection was performed after 240 days, and quantification was carried by the enzymatic method. Bars represent the standard deviation between 3 biological replicates. * p_value < 0.05 (Mock-inoculated × CLas inoculated).

