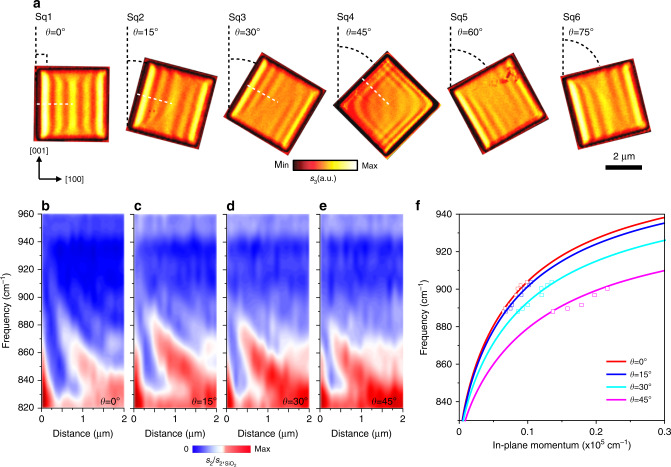
Fig. 2. Edge-tailored PhPs in square α-MoO3 nanocavities.
a Real-space imaging of edge-tailored PhPs in rotated square nanocavities (side length: 4 μm; thickness: d = 175 nm) which was fabricated in the same piece of α-MoO3 sample. b–e Nano-FTIR spectral line scans perpendicular to the rotated edges (white dotted lines in Sq1–Sq4), showing the near-field amplitude s2(ω) (normalized to the near-field amplitude on the SiO2 substrate, s2,SiO2(ω)) as a function of distance between tip and edge. Color dashed lines are guides for the eye of signal maxima. f Dispersion relation of hyperbolic PhPs in square α-MoO3 nanocavities. The red, blue, cyan and pink line corresponds to the theoretical dispersions at different rotation angles θ = 0°, 15°, 30°, and 45° respectively. The squares correspond to the experimentally measured data.

