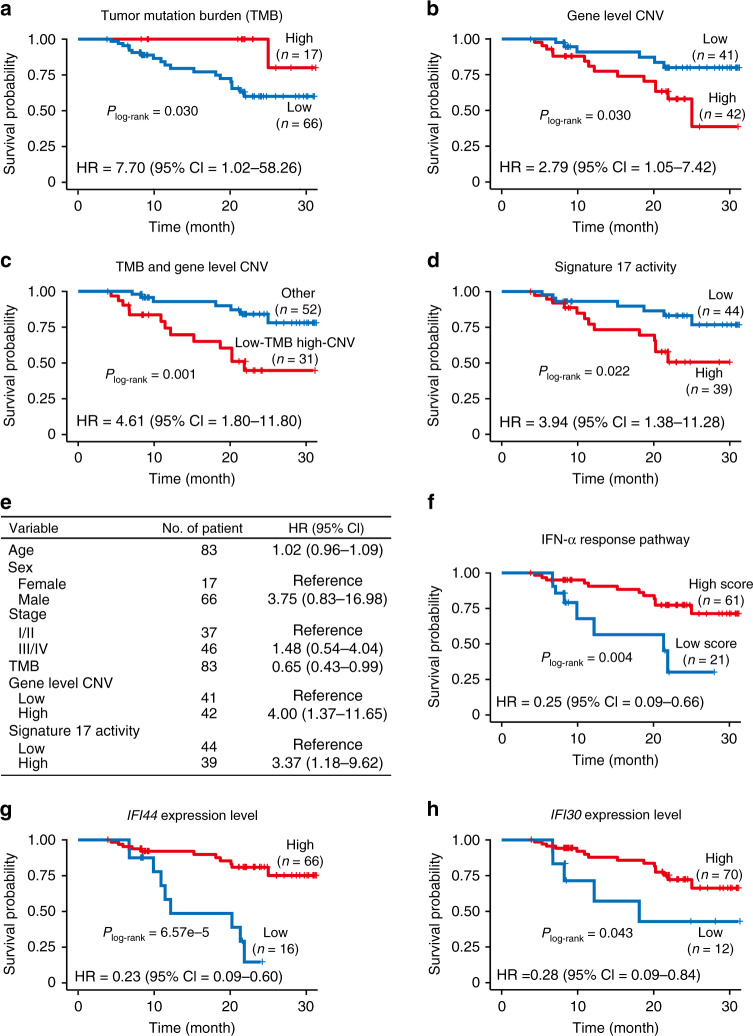
Fig. 5. Survival-associated genomic and transcriptomic features of ACGEJ.
a–d Kaplan-Meier (KM) curves of patient survival according to TMB (a), gene level CNVs (b), TMB and gene level CNVs combined (c), and Signature 17 activities (d); P values derived from log-rank tests. e Multivariate Cox regression analysis of the effects of different genomic alterations on ACGEJ patient survival. f−h KM curves of patient survival according to the GSVA scores of IFN-α response pathway (f) and the expression levels of IFI44 (g) or IFI30 (h) gene; P values derived from log-rank tests. Also present with each KM plot are the hazard ratio (HR) and 95% confidence interval (CI) from multivariate Cox proportional hazard models including age, sex, tumor stage, TMB, and gene level CNVs as covariates wherever necessary.

