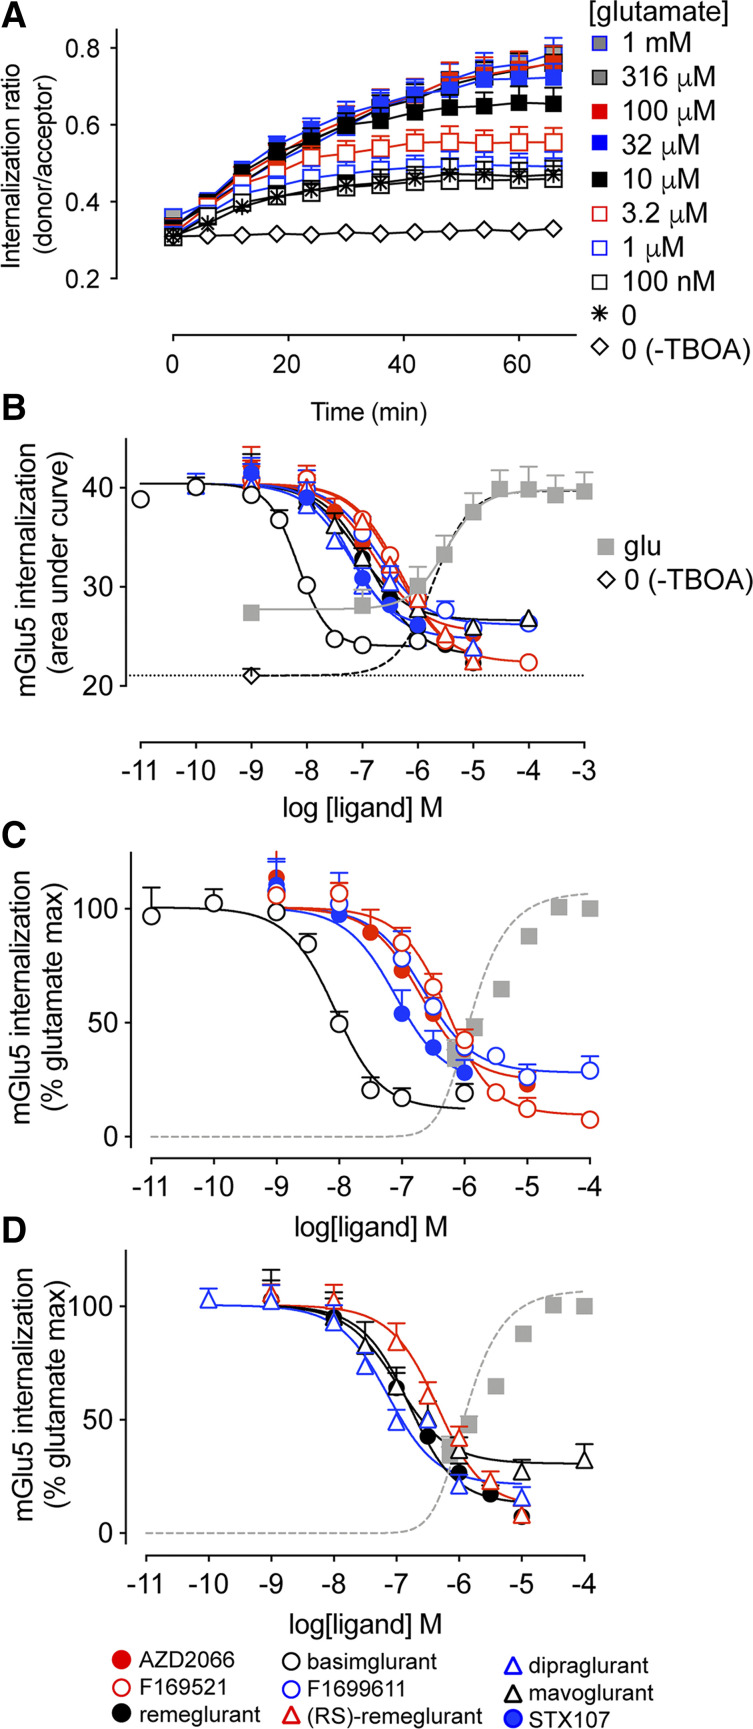
Fig. 4.
l-glutamate–induced mGlu5 internalization and modulation by NAMs. (A) l-glutamate (added at t = 0) concentration-dependently increases mGlu5 internalization over time (based on FRET between fluorescein-O′-acetic acid and Lumi4-Tb–labeled SNAP-tagged mGlu5), achieving a maximal level within 60 minutes. DL-TBOA was included in these experiments to prevent glutamate transport and isolate changes in surface mGlu5 due to extracellular stimulation; however, this also results in apparent mGlu5 internalization over time in the absence of exogenously applied l-glutamate. In the absence of DL-TBOA, mGlu5 surface levels remain constant. (B) The area under the curve of real-time internalization ratios (ratio of donor and acceptor emissions) over 66 minutes were calculated to plot concentration-response curves. Cells were incubated with NAMs for 30 minutes prior to addition of a submaximal concentration (11.6 μM) of l-glutamate. The dashed line is the nonlinear fit of the l-glutamate response when the bottom plateau is constrained to equal the basal condition (no DL-TBOA, plotted here at −9) and glutamate concentrations below the EC50 excluded from the fit. (C and D) Data in panel B were normalized to the l-glutamate maximum response (100%) with the basal system response (no DL-TBOA) set to zero and fitted with an operational model of allosterism. In all panels, data are means + S.E.M. from three independent experiments performed in triplicate. Error bars not shown lie within the dimensions of the symbol.

