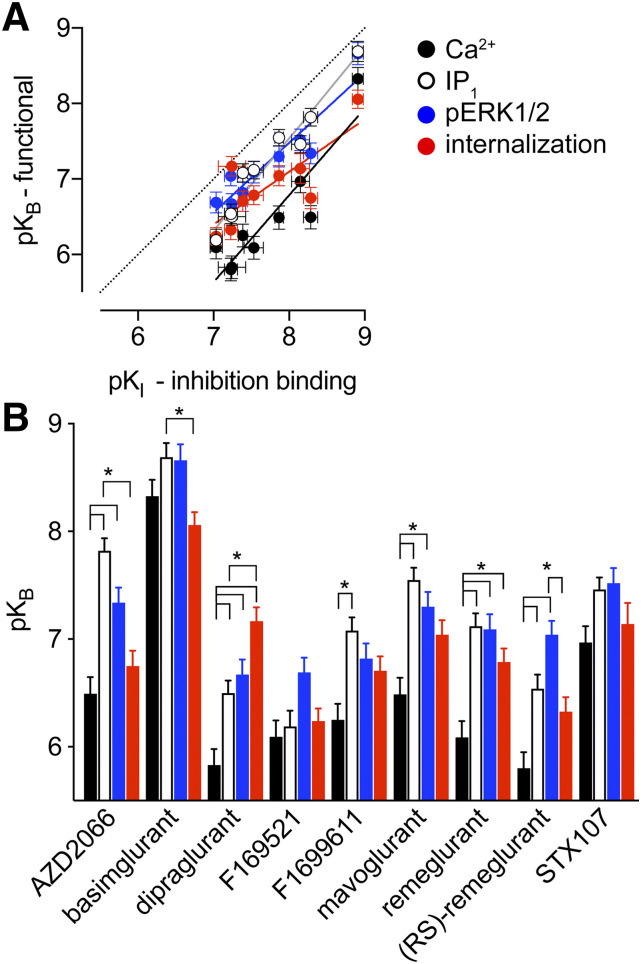
Fig. 5.
Comparison of mGlu5 NAM affinity estimates between binding and functional measures. (A) Correlation plot for functional pKB estimates relative to inhibition binding derived pKI values for nine mGlu5 NAMs. In all cases, pKB estimates were lower than pKI values; however, there were significant correlations between binding pKI and pKB values from Ca2+ (R2 = 0.816; P = 0.0008), IP1 (R2 = 0.946; P < 0.0001), ERK1/2 phosphorylation (R2 = 0.866, P = 0.0003), and internalization (R2 = 0.631, P = 0.0106). The 95% confidence intervals of the slopes of the linear regressions for Ca2+ (black line), IP1 (gray line), and ERK1/2 phosphorylation (blue line) all included 1, but internalization (red line) was significantly different (slope = 0.70, 95% confidence interval = 0.44–0.96). Unity is represented by the dotted line. (B) Affinity estimates for each ligand across the four measures of mGlu5 function. *P < 0.05, one-way ANOVA Tukey’s multiple comparisons post-test.

