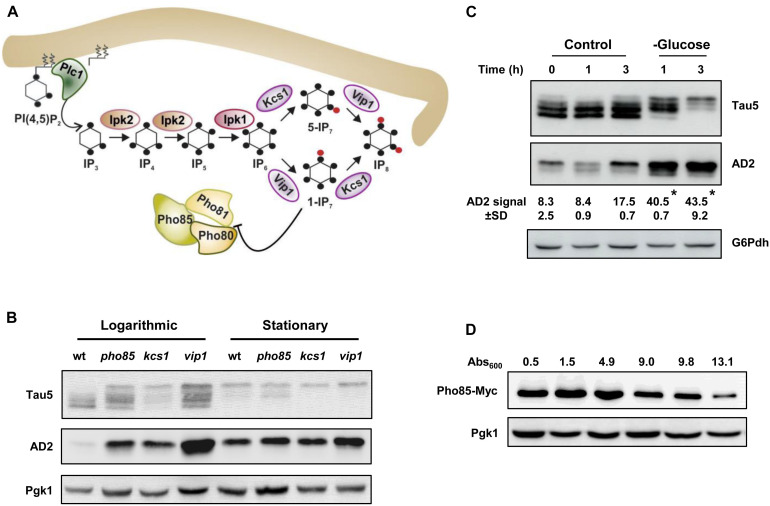
FIGURE 1.
Glucose availability, Pho85, and inositol hexakisphosphate kinases influence tau phosphorylation. (A) Schematic representation of the inositol phosphate (IP) pathway and its interaction with the Pho80-Pho81-Pho85 complex. The metabolic steps and enzymes involved in the synthesis of IPs and diphosphoinositol phosphates (DPIPs) are shown (see Dubois et al., 2002; Mulugu et al., 2007; Lin et al., 2009; Wilson et al., 2013 for representative reviews). The hydrolysis of PI(4, 5)P2 by Plc1 generates IP3, which is sequentially phosphorylated to form in the last steps the DPIPs 1-PP-IP5 (1-IP7) and 5-PP-IP5 (5-IP7) through the action of the inositol hexakisphosphate kinases Vip1 and Kcs1 (IP7 and IP6 kinases, in mammals), respectively. The 1-IP7 isomer acts as an inhibitor of the cyclin-regulated kinase complex Pho81-Pho80-Pho85 (Lee et al., 2007), which responds to phosphate availability (Lee et al., 2008). The black dot indicates a single phosphate group. The red dot represents a high-energy phosphate or pyrophosphate. For more details, see text. (B) Transformants of the CEN.PK2-1C wild-type (wt), pho85, kcs1, and vip1 strains harboring the plasmid pYX212-Tau2N/4R (Vandebroek et al., 2006), which express a native isoform of tau, were grown to the mid-logarithmic phase (Logarithmic) in SCD-Ura medium at 30°C. An aliquot of each culture was withdrawn, and the rest was kept under the same conditions until glucose was exhausted (stationary). Protein extracts were prepared and analyzed by SDS-PAGE and Western blot. Antibodies against human tau sequence 218-225 (Tau5) and phospho-S396/S404 epitopes (AD2) were used to visualize total and hyperphosphorylated tau, respectively. The abundance of phosphoglycerate kinase 1 (Pgk1) visualized with anti-Pgk1 was used as loading control. (C) Cell cultures of pYX212-Tau2N/4R transformants of the CEN.PK2-1C wild-type strain were grown until reaching an Abs600 ∼0.3 in SCD-Ura. Then, an aliquot was processed (control, 0 h) and the rest of the culture was centrifuged. Cells were washed, transferred to fresh SCD-Ura medium (control), or to the same medium containing 0.01% glucose (glucose) as sole carbon source, grown at 30°C, and samples were taken at the indicated times for Western blot analysis of tau isoforms. Total and hyperphosphorylated tau were visualized by using Tau5 and AD2 antibodies, respectively. The numbers show the AD2 band intensity (±SD) expressed as arbitrary units, which was determined using ImageJ software and normalized relative to the glucose 6-phosphate dehydrogenase control (G6Pdh). Data are the mean (±SD) of three independent experiments. Statistical significance was determined by using a Student’s t-test with the Excel software (Microsoft). The glucose starvation samples (glucose) were significantly different compared with their respective control at the same incubation times (*p < 0.05). (D) Pho85-Myc tagged cells of the CEN.PK2-1C wild-type strain were grown at 30°C in SCD-Ura medium, harvested at the indicated Abs600 values, and protein extracts were compared for Pho85 abundance by Western blot. An antibody against Myc was used. Representative experiments are shown.

