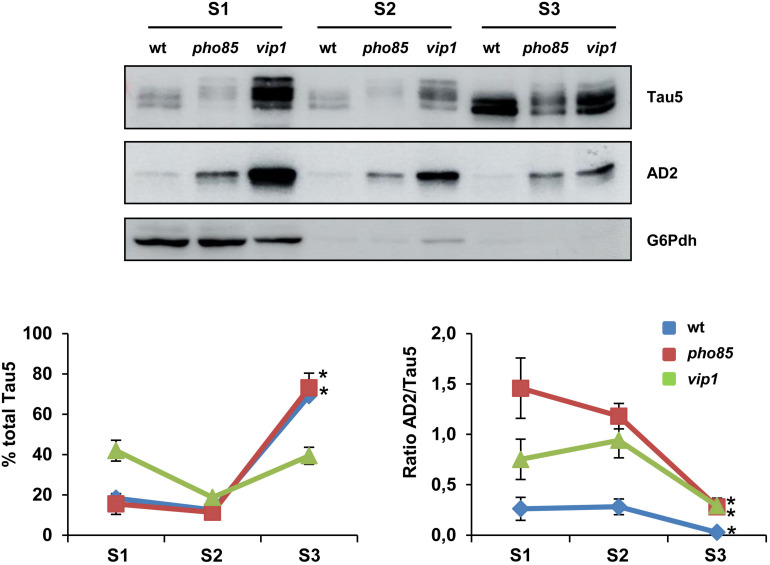
FIGURE 2.
tau localization is influenced by its phosphorylation. Transformants of the CEN.PK2-1C wild-type (wt), pho85 and vip1 mutant strains expressing native tau (pYX212-Tau2N/4R) were grown until reaching an Abs600 ∼0.3 in SCD-Ura. Protein extracts were processed, fractionated, and analyzed as described in the “Materials and Methods” section. Three fractions, soluble proteins (S1), Triton X-100-soluble proteins (S2), and Triton X-100-insoluble proteins (S3) were analyzed for total and hyperphosphorylated (phospho-S396/S404 epitopes) tau isoforms by using Tau5 and AD2 antibodies, respectively. The graphs show the relative abundance (%) of total tau (left panel) and the ratio between AD2 and total tau (AD2/Tau5; right panel) for each strain and protein fraction. Band intensities were determined using ImageJ software and normalized relative to the glucose 6-phosphate dehydrogenase control (G6Pdh). Total tau was estimated as the sum of band intensities of tau isoforms with apparent molecular weights varying from 64 to 72 kDa. Data are the mean (±SD) of three independent experiments. Statistical significance (∗p < 0.05) was determined for S3 sample averages compared with S1 sample averages of each strain. Representative Western blot images are shown.

