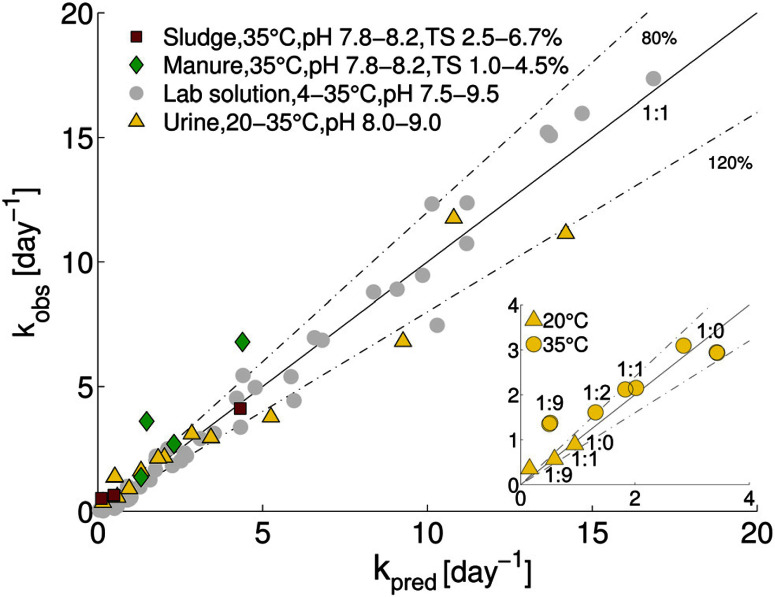
Fig. 2.
Comparison of measured and predicted MS2 inactivation rate constants for stored urine, sludge and manure. For comparison, data from lab solutions (Decrey et al.;15 grey circles) are also shown. Values of kpred were determined from eqn (3) and (4). The solid line represents a 1 : 1 relation between measurement and prediction (kpred/kobs = 1). Dashed lines indicate 80% and 120% of kpred/kobs (i.e., kpred/kobs = 0.8 and 1.2 respectively). The inset shows kpred versus kobs for different dilutions of urine. The urine : water ratio for each data point is indicated.

