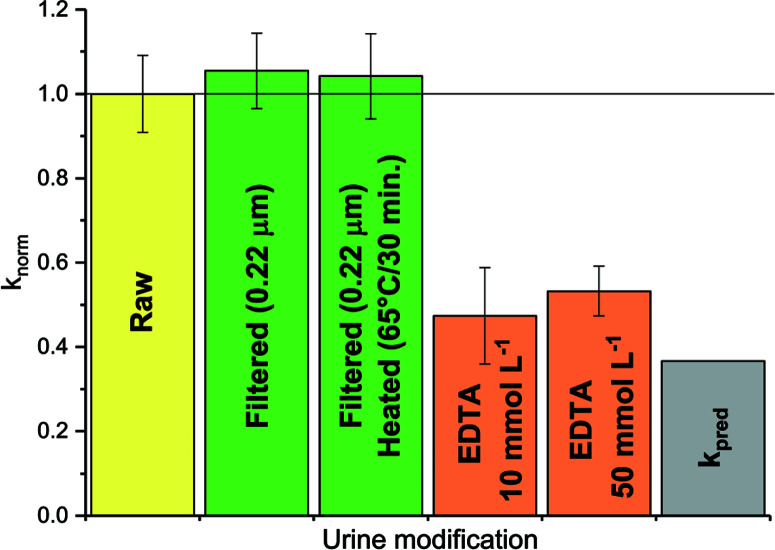
Fig. 4.
MS2 inactivation rate constants determined at 35 °C in 1:9 diluted, raw or modified urine. Modifications were filtration and heating to remove microbial or enzymatic activity (green), and addition of EDTA to complex metal ions (orange). Also shown are the rate constants in raw urine kobs (yellow) and the predicted rate constant kpred (grey). knorm corresponds to the ratio of the kobs determined in the modified urine samples and kobs in raw 1 : 9 diluted urine (yellow). Error bars depict 95% confidence interval associated with knorm.

