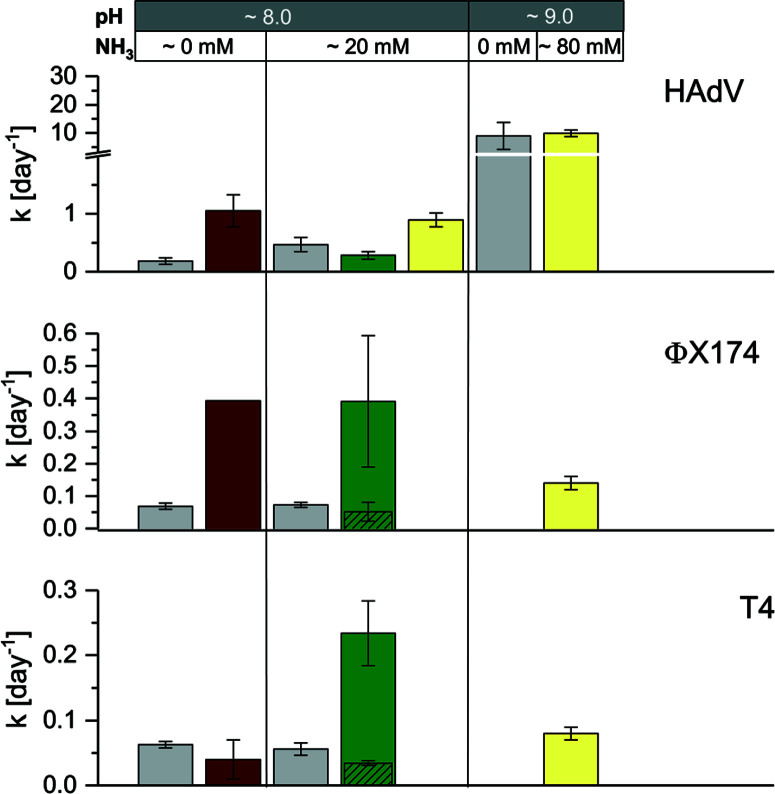
Fig. 5.
Comparison of virus inactivation in laboratory solution (grey bars), stored urine (U4 [pH 8.0, 20 mmol L−1 NH3], U12 [pH 9.0, 80 mmol L−1 NH3]), sludge (S2) and manure (M4) at 35 °C. Kinetics in laboratory solution (from left ot right: phosphate carbonate buffer [pH 8.0, 50 mmol L−1 carbonate, 60 mmol L−1 phosphate] and ammonium carbonate [pH 8.0, 50 mmol L−1 carbonate, 20 mmol L−1 NH3]) were derived from Decrey et al.,16 except for HAdV at pH 9.0 (phosphate buffer [pH 9.0, 50 mmol L−1 carbonate, 40 mmol L−1 phosphate]). The exact rate constants for U4, U12, S2 and M4 are listed in Table S2.† For ΦX174 and T4 in M4, columns with diagonal patterns depict kobs_slow. Error bars depict 95% confidence interval associated with kobs.

