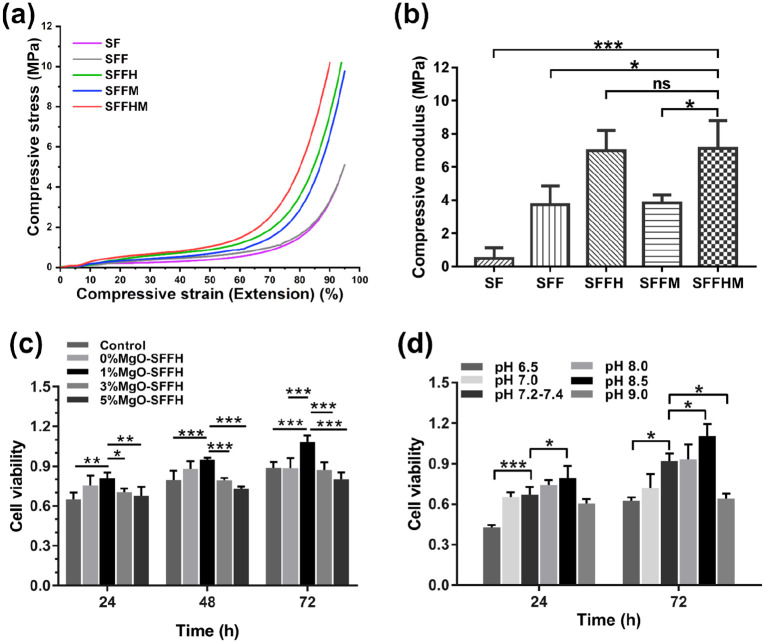
Figure 3.
Mechanical properties and cell viability of scaffolds. (a) Graph representing compressive stress-strain curves of various silk scaffolds. (b) Compressive modulus. (c) Cell viability of BMSCs cultured in complete medium and in scaffold soaking solution with MgO at different concentrations. (d) Cell viability of BMSCs cultured in complete medium at different pH values.
(*p < 0.05, **p < 0.01, ***p < 0.001, ns = not significant, n = 5).

