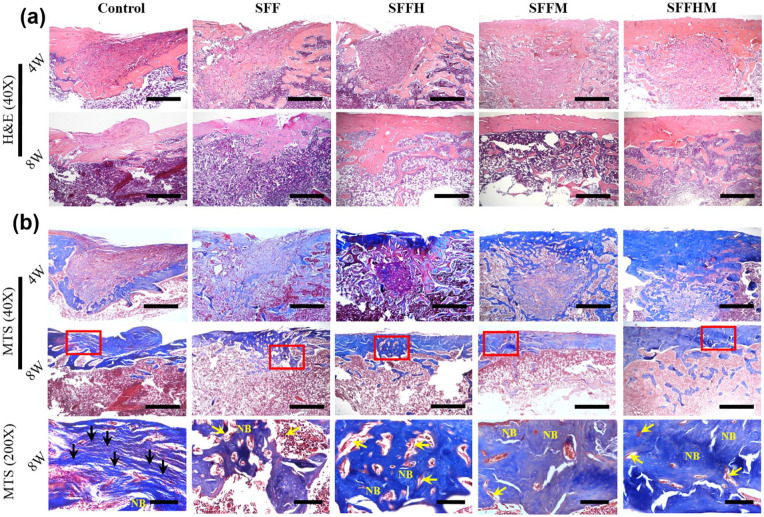
Figure 7.
Histological evaluations of the regeneration of bone defects at 4 and 8 weeks after surgery, representative images of H&E staining (a) (scale bar = 100 µm, 40×) and corresponding Masson’s trichrome staining, (b) scale bar: upper two rows 100 µm (40×), and bottom row 20 µm (200×), respectively. NB represent new bone, black arrows indicate fibrous tissue, yellow arrows shows remnant of scaffolds.

