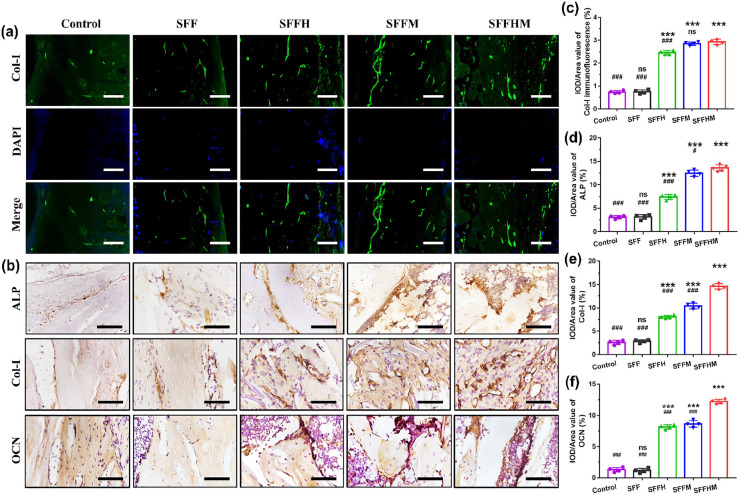
Figure 8.
Immunostaining of bone tissue specimens at 4 and 8 weeks: (a and c) Immunofluorescence images of Col-I expression and quantitative analysis for tissue sections after scaffolds implantation 4 weeks (green: OCN; blue: DAPI), (b) Immunohistochemical images of ALP, Col-I and OCN expression, scale bar = 100 µm (400×). (d–f) Quantitative analysis of new bone formation expressed as ALP, Col-I and OCN levels.
***p < 0.001, compared with Control group; #p < 0.05, ###p < 0.001, compared with SFFHM group; n = 4, ns = not significant).

