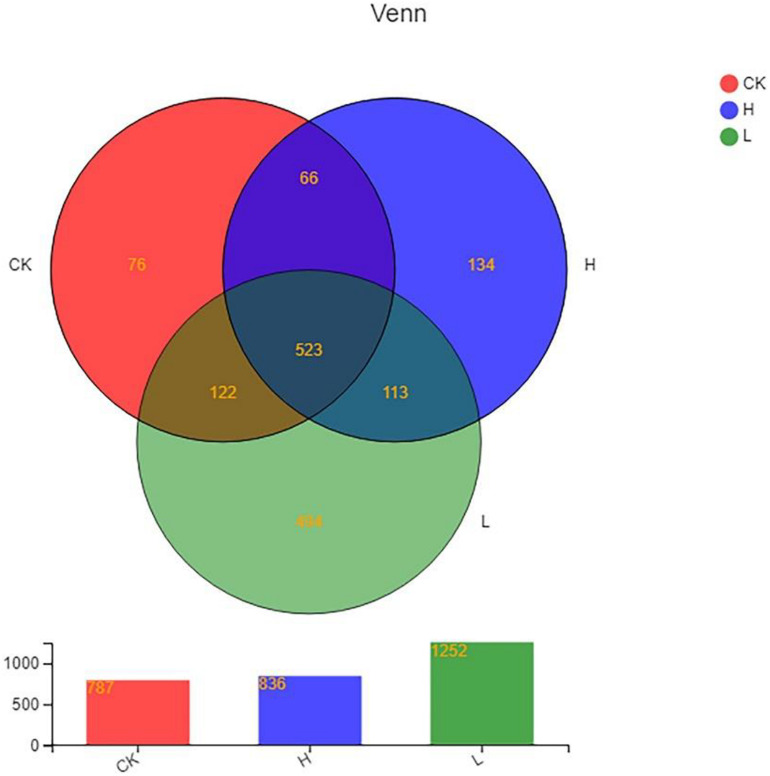
FIGURE 6.
Venn diagram showing the number of OTUs shared and unique among different samples. (Group CK: the unpeeled potato tubers were treated with blank medium, the content of solanine was 273 mg/kg; Group L: the unpeeled potato tubers were treated with the active ingredient 40–20, the content of solanine was 163 mg/kg; and Group H: the unpeeled potato tubers were treated with the active ingredient 20–30, the content of solanine was 344 mg/kg).

