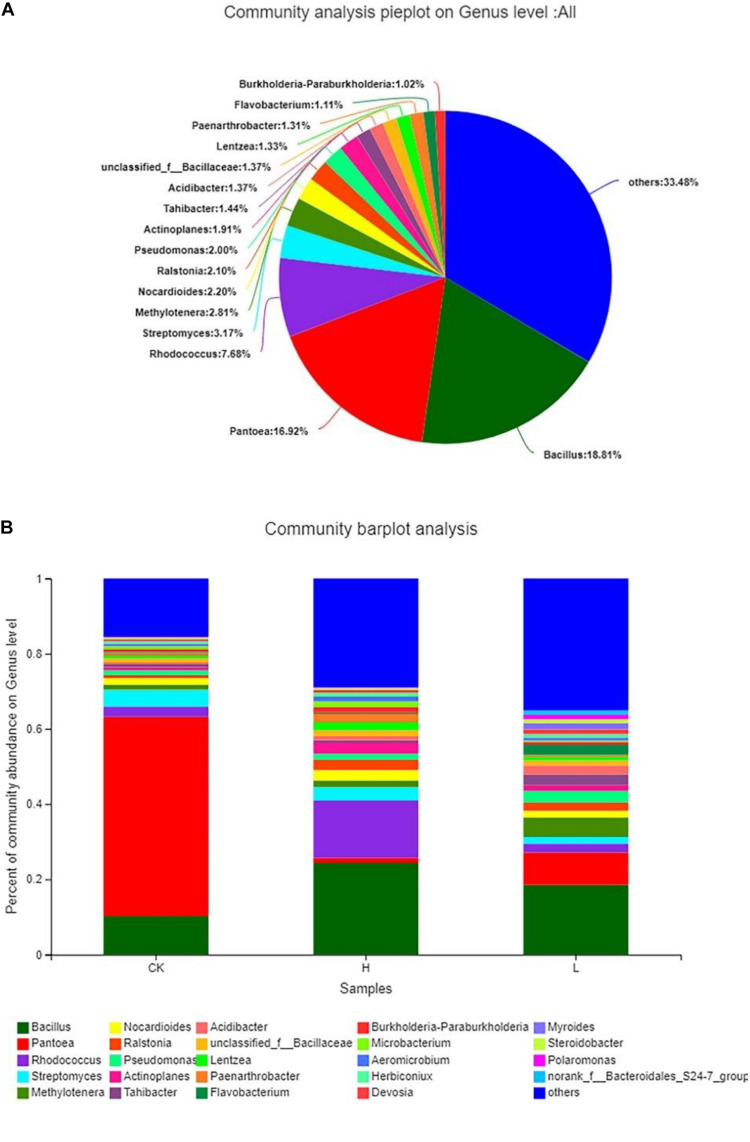
FIGURE 8.
Composition and relative abundance of endophytic bacterial on the genus level. (A) Community analysis pie plot on the genus level of the culture-independent endophytic bacteria on the whole. (B) Composition and relative abundance of endophytic bacterial in different samples on the genus level. The color of the column represents the different genera, and the length of the column represents the proportion size of the genus. Sequences that could not be classified into any known group were assigned as “unclassified.” Genera making up less than 1% of total composition in each sample were classified as “other.” (Group CK: the unpeeled potato tubers were treated with blank medium, the content of solanine was 273 mg/kg; Group L: the unpeeled potato tubers were treated with the active ingredient 40–20, the content of solanine was 163 mg/kg; and Group H: the unpeeled potato tubers were treated with the active ingredient 20–30, the content of solanine was 344 mg/kg).

